Download

1 / 88
880 likes | 1.07k Views
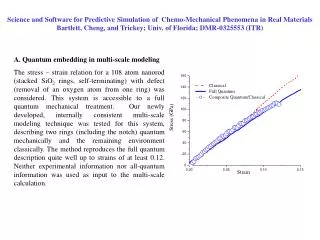
Multi-scale Modeling in Systems Biology. Maksudul Alam & Madhav Marathe Network Dynamics and Simulation Science Laboratory June 12, 2014. Modeling Mucosal Immunity —— Summer School & Symposium in Computational Immunology. Goals for today’s lecture.

E N D
Multi-scale Modeling in Systems Biology MaksudulAlam & Madhav Marathe Network Dynamics and Simulation Science Laboratory June 12, 2014 Modeling Mucosal Immunity —— Summer School & Symposium in Computational Immunology
Goals for today’s lecture • What is multi-scale modeling, the notion of scale • Why is multi-scale modeling important? When should I consider it? • What issues should I consider when developing a multi-scale model. What are the pitfalls • On-going efforts on multi-scale modeling in Systems Biology • A simple example • Mathematical and computational foundations • An example using ENISI • References
Material for Today’s Lectures • Sloot P and Hoekstra A (2009) “Multi-scale modelling in computational biomedicine”, Briefings in Bioinformatics, Vol II, No. I, p. 142-152 • Example and slides for multi-scale modeling of heart are adapted from a presentation by Jennifer Young at Rice University http://www.caam.rice.edu/~jjy5/index.html • Hegewald J, Krafczyk M, Tolke J, Hoekstra A and Chopard B, (2008) “An Agent-Based Coupling Platform for Complex Automata”, Lectures in Computer Science, Vol 5102, p. 227-233 • Schnell S, Grima R and Maini P, (2007) “Multiscale modeling in biology” American Scientist, Vol 95:2 , p. 134-142 • Alberts B, Johnson A, Lewis J, Raff M, Roberts K, Walter P, Molecular Biology of the Cell, Garland Science, 1994 • E W, Engquist B, “Multiscale Modeling and Computation”, Notices of the AMS, Vol 50:9, p. 1062-1070 • H Schneider, T Klabunde (2013), “Understanding drugs and diseases by systems biology?”, Bioorganic & Medicinal Chemistry Letters • M Meier-Schellersheim, I Fraser, and F Klauschen (2009), “Multi-scale modeling in cell biology”, Wiley Interdiscip Rev SystBiol Med. • J Dada and P Mendes (2011), “Multi-scale modelling and simulation in systems biology”, Integrative Biology • J. Walpole, J. A. Papinand S. M. Peirce (2013), MultiscaleComputational Models of Complex Biological Systems, Ann Review of Biomedical engg.
What is multi-scale modeling? • “Multi-scalemodeling refers to a style of modeling in which multiple models at different scales are used simultaneously to describe a system.” • Different models focus on different scales of resolution • Sometimes originate from physical laws of different nature (e.g. from continuum mechanics and molecular dynamics)
Scales in Biosystems? • Scale defines the level of granularity of a biological level using time,space and functional domain • Typical scales: • Intracellular Scale (nanometers, milliseconds) • Cytokine Fluid Scale (micrometers, seconds) • Cellular Scale (millimeters, minutes) • Tissue Scale (centimeters, hours)
Multi-scale modeling in biological systems • Explicit models of complex biological systems integrated across temporal, spatial, and functional domains. Through simultaneous evaluation of multiple tiers of resolution, MSM capture systems behaviors not observable using single-scale techniques. • Important topical area in biosystems modeling – interagency modeling group and Multi-scale modeling consortium established for this reason by NBIB
Classifying models in Biosystems • Top down versus Bottom up • Both approaches have problems and advantages • Continuous versus Discrete • Continuous techniques: space and time is continuous and continuous functions and differential equations are used to represent relationships between various factors • Discrete techniques: space and time is discrete: Boolean networks, CA, network models, Discrete dynamical systems • Statistical/Phenomenological versus mechanistic/causal • Just being mechanistic need not imply the models have explanatory power
Importance of multi-scale modeling • Conceptual clarity • Natural way to represent biological systems • Understand the behavior of biological systems • Bridge the gap between isolated in vitro experiments and whole-organism in vivo models • How a change in micro-level factor (e.g. gene modifications) affects macro-level measurable changes (e.g. lesion forming) and vice versa? • Powerful tool to capture & analyze information otherwise inaccessible via single scale models • Few existing ready-to-use tools
When should I consider multi-scale modeling in biosystems? • Biological questions that demand representation of explicit models of relevant scales • Either data is available or can be collected to develop an explicit model at that scale. Else when goal is to put forward an explanation of the mechanism at a specific scale • Sufficient computational resources are available • Domain expertise is available
Interactions between scales J. Walpole, J. A. Papin and S. M. Peirce (2013), Multiscale Computational Models of Complex Biological Systems, Ann Review of Biomedical engg.
What are the pitfalls? • Meaningful explicit models for relevant scales • Information exchange between models • What information, how often, correctness • Computational complexity • More scales implies more complexity in general • Availability of data
Example 1: The Heart • The Heart • Physical Scale: 10 cm = 10-1m http://www.healthcentral.com/heart-disease/what-is-heart-disease-000003_1-145.html
Example 1: The Heart • Artery • Physical Scale: mm = 10-3m • Red Blood Cell • Physical Scale: μm = 10-6m http://www.pennmedicine.org/health_info/bloodless/000209.html http://www.fi.edu/learn/heart/blood/red.html
Modeling ISR • Coronary Artery Disease: Accumulation of plaque in the arteries • Treatment: place a metal stent in artery to keep it open, blood flowing • In-Stent Restinosis (ISR): build-up of new cells in the area where initial problem was • Goal is to prevent ISR from occurring in patients
Example 1: ISR • Scale of Interest: • Physical Scale: Cell to Artery (micron to cm) • Time Scale: Seconds to Months • Processes of Interest: • Initial injury due to stent • Platelet aggregation • Red blood cell Thrombus formation • Cell cycle, cell signaling • Blood Flow • Drug Diffusion
Modeling ISR • Visual Map of Processes and Scales
Modeling ISR • Single Process Models are available • Integration done using a coupling computer program (COAST) • Example Simulation:
What determines whether a person is infected upon exposure and the severity of subsequent disease? The consequence of exposure • Complete tolerance that leads to non-pathogenic microbe persistence • Hypo-inflammation in which a pathogen is not completely eliminated • Inflammation that eliminates the microbe, but ceases prior to extensive tissue damage • Hyper-inflammationin which the microbe is eliminated at expense of host tissue damage Which aspects of these competing pathways could be exploited to inhibit pathogen invasion, infection, and evolution?
Our first attempt: Realization in ODEs Replenishment rate Rate of contact with bactieria Regulatory M2 in tissue Rate of M1 to M2 Rate of conversion to M1
Calibrating the model • Molecular level • Relative secretion of IL-12, IFNy, IL-4, IL-17, IL-23, TGF-B, MCP-1, IL-10, and IL-2 upon antigen recognition by CD4+ T-cells, macrophages, dendritic cells • Cellular level • Cytokine ratios at which M1 becomes M2 (alternatively activated) • Tissue level: • How long do cells spend in tissue of gut mucosa during circulation?
The ODE realization makes assumptions • Determinism vs Stochasticity • Infinitely divisible vs discrete entities • Mass action (uniform mixing) • Spatial homogeneity within compartments
Consider alternative representation theory: Cellular Networked Immunology • Represent individual cells as agents/nodes of a network • Capture the interactions via a dynamic network • Local functions are endowed to the cells …. More on this later.
ENISI: An (agent) interaction based modeling framework for in-silico study of GI mucosa • ENISIcan be used to model immune response of gastrointestinal(GI) tract or gut mucosa and its component immune cells in response to foreign microbes. • Inflammatory Immune Response: • The response that protects the body by eliminating pathogen and damaged cells. • Constant inflammatory response can induce host cell damage. • Regulatory Immune Response: • Down-regulates the inflammatory response to protect the body against constant inflammation.
What is ENISI • ENISI is a modeling environment; it is NOT a specific model. • Models for specific pathogens can be derived from ENISI. • Leads to generality and efficiency • Users can interact with ENISI at three different levels depending on their computational expertise • Via the ENISI User interface: (no training is required) • Via configuration file to change model specific parameters (requires basic understanding of Linux environment) • Making code changes to the modeling environment
What is ENISI: A modeling environment that supports Networked Immunology • ENISI based on a formal mathematical framework: a co-evolving graphical dynamical system (+ some aspects of Statecharts) • ENISI is specifically designed to map on modern high performance computing architectures. • Demonstrated using Shadowfax cluster at VBI • Can simulate 108 individual cells on a modest parallel cluster in < 1hr
What is ENISI • Causal Model Based Immune Systems Biology • Guide targeted biological experiments • Provide a causal and procedural explanation of the underlying system • Big Data Immunoinformatics • ENISI produces large amounts of highly detailed spatio-temporal data. The data can be aggregated to the desired level for calibration and validation.
What is an Agent-Based Model (ABM)? • Things: nouns • individual entities • collections of entities • with states: adjectives • finite set • continuous or discrete • parameterized
What is an Agent-Based Model (ABM)? • that interact: verbs • what interacts with what? • is the network of interactions static or dynamic? • what makes it dynamic? Brownian motion, chemotaxis • according to a mathematical rule: adverbs • deterministic vsstochastic • continuous vsdiscretein time
What does an ABMcompute? Interactions among things correlate their states. Each time step in each run gives the state of the system at that time: The state in any one run is a sample from the joint distribution of possible states: (kN numbers) (kNnumbers)
ENtericImmune SImulator (ENISI)Modeling Environment • Host cells and bacteria are agents • Each agent represented as an automaton • Agents move around gut mucosa and lymph nodes • Nearby agents are “in contact” • Agents in contact can interact: • Agent-Agent interaction • Group-Agent interaction • Timed interaction • We will be considering an ENISI model for H. pylori infection
A complete description of the resulting joint distribution is impossible Describing the distribution for just 32 cells, each with 3 states – here Naive, Inflammatory, Regulatory – would require 1.5 PB
Instead, compute averages over multiple simulations (Monte Carlo samples) • Each run of the (stochastic) simulation produces a different result, drawn from the joint distribution • Estimating the joint distribution itself is not feasible • Statistics of the joint distribution can be estimated from many samples Efficient computation is essential!
ENISI: Agents • Participating cells • CD4+ T Helper Cells • Natural T Regulatory Cells • Dendritic Cells • Macrophages • Epithelial Cells • Bacteria • Commensal Bacteria • Tolerogenic Bacteria Bacteria CD4+ T-cells Epithelial Cells T Reg Macrophage Dendritic Cells
An interaction network for the immune system Vertices -> cells/bacteria Edges -> cytokine-mediated interaction Interactionschangecells’ behavior andneighbors, producingimmune system dynamics.
Targeted interventions can berepresented as network changes pathway disruption knock-outs antigen priming regulated expression
ENISI: Tissue Sites • Participating cells are located in the GI tract. • Cells move around the tissue sites. • Tissue Sites: • Lumen • Epithelial Cells • Lamina Propria • Gastric Lymph Node Gastrointestinal Tract (cross-section)
Automata-based representation of an Agent • Each cell is represented as a probabilistic finite state automaton • The states of a cell is called phenotype. • State transition represents: • Cell differentiation • Cell death • Cell migration • State transition is: • Stochastic • Time dependent • Contact dependent Macrophage Automaton
Layered view • Red cellsparticipate in inflammatory response • Blue cellsparticipate in regulatory response • Green cells participate in either response • Cells are compartmentalized. Macrophage Automaton
ENISI Modeling Assumptions • Cell differentiation is modeled using a probabilistic finite state automaton • Based on statistical approach • Phenotype change is probabilistic • Cytokines are not represent directly • Cells can change phenotype with presence of other cell types in close proximity • Those other cells are assumed to secrete cytokines, although there is no real cytokines modeled • Random movement • Movement from one spatial unit to other is considered random • No chemokine induced movement is considered
Mapping ENISI on HPC architectures Can simulate 107- 108 cells or ~1% of mouse gut in 1½ hours on 576 cores Other systems limited to at most 104 cells (Rhapsody)
Example: H. Pylori 26695 Pathogenicity • Experimental infection of H. pylori 26695 on mice. • GOAL: • In H. pylori mediated pathogenesis, in the 85% cases, we observe no lasting epithelial cell damage. But for 15% of the cases we observe chronic cell damage. We want to find out what is causing this chronic cell damage. • Experiment: • In ENISI we infect the in-silico gut with H. pylori after 2 days and simulate the infection for 63 days. • Data collected from a in-vivo experiment on mice on days 7, 14, 30 and 60 post infection.
Example: H. Pylori 26695 Pathogenicity • Conclusion • Reveals a positive feedback loop triggered by H. pylori infection where chronic epithelial cell damage is observed even when there is no remaining active H. pylori in the gut. • With the knowledge of feedback loop we now have a hypothesis for this chronic epithelial cell damage and can test this is the lab by treating mice with appropriate medicine.
ENISI Multi-scale Modeling(ENISI MSM) • Multi-scale modeling platform • Extension to ENISI, an agent-based modeling environment for mucosal immunity • Integrating agent-based modeling, PDE, and ODE • Modeling tissue, cells, chemokines, cytokines, and intracellular pathways • Introducing chemokine dependent movements and cytokine dependent differentiation
Scales of ENISI MSM • Tissue Scale • Cellular Scale • Chemokine Scale • Intracellular Scale
Intracellular Model: CD4+ T cell computational model • Comprehensive T cell differentiation model • 94 species • 46 reactions • 60 ODEs • A deterministic model for in silicoexperiments with T cell differentiation: Th1, Th2, Th17, and Treg ODE intracellular model
Chemokine/Cytokine Fluid Scale • Cytokines and chemokines are small molecules • Cytokines play vital role in cell differentiation • Chemokines play vital role in cell movement • Chemokines and cytokines are produced by the cells • Each cytokine or chemokine has diffusion process of the form: • L(x,y,z)=concentration of cytokine/chemokine • D=diffusion rate • =degradation rate • Realized with partial differential equations (PDE) • Diffusion also changes the concentration of cytokines or chemokines Cytokine/Chemokine Diffusion