Download
1 / 34
340 likes | 476 Views
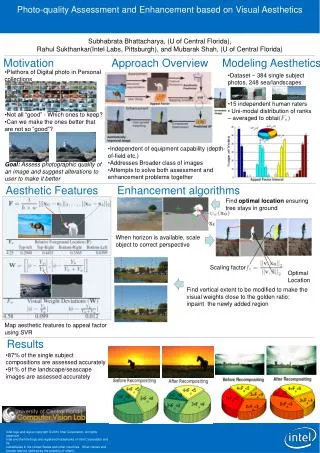
Taming subjective problems with hand-coded metrics. Automatic photo quality assessment. How do you measure a subjective quality quantitatively and objectively?. Find a consensus - Only look at things that everyone agrees on Get people to vote, and average the results

E N D
Taming subjective problems with hand-coded metrics Automatic photo quality assessment
How do you measure a subjective quality quantitatively and objectively? • Find a consensus - • Only look at things that everyone agrees on • Get people to vote, and average the results • Get people to pass judgments multiple times • Discard outliers • Ignore ambiguous cases, and focus on cases where you can be more certain
What are some subjective qualities of images? What are some subjective qualities of images? What are some subjective qualities of images? • Professional or “snapshot”? • Aesthetically pleasing, or not? • Photorealistic or not? • “Original” or not? • “Familiar” or not?
It's the one on the left Images taken from http://www.autodesk.com/eng/etc/fake_or_foto/about.html without permission, so don't tell anyone.
What makes a photograph memorable? • Humans prefer colorful things (look for color saturation) • Good photographs should have good composition (What is that?) • Technicalities (focus, contrast and exposure levels) • Images can also have interesting semantics (What is going on in the image?)
How do we use this? • Look at distribution of colors – Variance? Homogeneity? Contrast? Local gradients? • Composition – Similar to Saliency; image should have a clear subject – higher concentration of sharp edges close to the center of the image • Technicalities – Look for variations in intensity, signs of blurring • Semantics – Don't worry about that just yet
Past approaches • Ignore semantics – the state of the art just isn't ready for it yet • Focus on low-level details, which can be detected by hand-coded metrics • Get lots and lots of metrics • Train a classifier on them with labeled examples
Low vs. High Level Features • The papers distinguish between “low level” and “high level” features without defining the terms • We use “high level” to describe features which correspond directly to some camera property, or some human response to the image as a whole • Low level features thus refer to those which operate on, or close to, a per-pixel basis
Low Level Features • Mean pixel intensity • Contrast • Color distribution (compared with dist. Metric) • Mean color saturation and Hue variance • All of the above, but restricted to the center of the image • Texture variations • Edge densities
Mean pixel intensity • Proxy for brightness • Used to detect over or under exposure
Contrast • Compute gray level histograms for R,G,B channels • Sum into combined histogram H • The measure of contrast is the width of the middle 98% mass
Color distribution • Can look at distribution of pixels in color space • The types of colors used can tell something about the image. • Use a distribution distance metric to compare distributions of different images.
Rule of thirds • If you think of the image as a 3x3 grid, then the center square should have the most interesting things in it. • Take separate mean values there.
Image size • Professionals might use different aspect ratios in their film or final presentation, so look at size and shape of images; Nothing fancy • Can use (X + Y) as size rather than X*Y • X/Y for shape
High level features • Familiarity (by nearest neighbor method) • Blur level • H,S,V values of n largest patches (objects?) • Depth of Field indicators • Shape convexity • Perceptual edges (intensity vs. color, spatial distribution) • Saturation variation, hue count, color palette • Spatial edge distribution, color variation
Familiarity • Unique pictures are thought to be more original, and thus more interesting to look at. • See how much the image resembles other known images; the less it looks like known images, the more unique and original it is.
Blur Level • Estimating blur is a difficult problem • G. Pavlovic and A. M. Tekalp. Maximum likelihood parametric blur identificationbased on a continuous spatial domain model.IEEE Transactions on Image Processing, 1(4), 1992 • H. Tong, M. Li, H. Zhang, J. He, and C. Zhang. Blur detection for digital imagesusing wavelet transform. In Proceedings of International Conference on Multimedia and Expo, 2004. • One approach: assume Ib = Gσ * Is, and find an estimate for σ
Regional Composition • Could also look at the largest object in the image • Use clustering algorithm to do segmentation, then look at mean Hue/Sat/Intensity for each of the top 5 clusters bigger than 1% of the image size. (More hand-coded parameters.)
Low Depth of Field detection • Large aperture can blur everything outside of a certain range of depth. • Some photographers actually do this on purpose, and it can look good.
Color Edges vs. Intensity Edges • Determine intensity edges and count pixels • Normalize RGB components by pixel intensity and rerun edge detection to determine color edges • Pure intensity edges are not present in the normalized image. Hue does not change substantially over an intensity edge
Variation in Color and Saturation • Unique color count • U = # of unique colors / # of pixels • Pixel saturation • Convert image to HSV color space • Make a saturation histogram with 20 bins • S is the ratio between the count in the highest and lowest bins
Color Palette • Quantize RGB channels into 16 values • Make a 4096 bin histogram and normalize to unit length • Find closest matches among known professional photos and snapshots • Intuitively, looks for photos with closest color palettes
Hue Count • Convert image to HSV • Consider pixels with brightness in [0.15,0.95] and saturation > 0.2 • Construct 20-bin histogram on hue values • m = maximum value in histogram • N = {i | H(i) > αm} • αsets noise sensitivity • 20 - ||N|| is the number of “unused” hues.
Spatial Edge Distribution • Apply a Laplacian filter to the image to detect edges • Can compare a normalized Laplacian image to mean Laplacian for high and low quality images • Can also calculate area of bounding box enclosing a fixed percentage of edge energy • Cluttered backgrounds produce larger bounding boxes
Spatial Color Variation • For each pixel, fit a plane to a 5 x 5 neighborhood in normalized R, G and B. • Obtain three normals nR, nG, nB. They define a pyramid; sum the areas of the facets as a measure of local color variation. • R is the average summed area over all pixels.
Which were the good features? • In “Studying aesthetics in Photographic images using a computational approach” the best features were: • Mean saturation for biggest patch • Mean pixel intensity • Mean saturation in middle square • 3rd wavelet band for saturation • Top 100 familiarity score • LDOF saturation • Size (X + Y)
From http://www.the-romans.co.uk/painting.htm Paintings vs. Photographs From http://www.collectiblesgift.com/images/
Qualities of a Painting • Perceptual edges are color edges • High spatial variation in color • Large color palette • High saturation • We can use these features to measure “photorealism”
Another Approach: RGBXY Space • Each pixel is a point in 5-D space • An image defines a 5 x 5 covariance matrix of the RGBXY point cloud • Represent each image as a length 5 vector of the singular values of its covariance matrix • Paintings typically use larger color palettes and have larger spatial color variations
Waiting in line! by Imapix Professional Photo vs. Snapshot pot_goldfinger_lrg from www.cleanleaf.ca.
Qualities of a Professional Photo • Simplicity • Easy to distinguish subject from background • Surrealism • Professional photos tend to be distinctive • Technique • Less blur • Higher contrast • We can frame “professionalism” in terms of these qualities
Simplicity and Surrealism • Subject should be easily distinguished • Edges should be spatially concentrated • Cluttered images will have many more unique hues • Distinctive color palettes • Professional photos may have similar palettes
Technique • Professional photos will be higher contrast • Most cameras adjust brightness to 50% gray • Professional photographers will typically adjust for a 50% gray subject, disregarding the background • An overall deviation from 50% gray results • Some part of a professional photo will be in focus; we can expect less overall blur