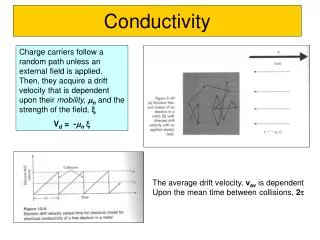
Electrical conductivity, EC
Electrical conductivity, EC. A quick method to measure the salinity of water. EC is approximately one-tenth of the total dissolved cation, or anion concentration. EC units for salt tolerance: dS/m or mmho/cm not micromho/cm ( μmho/cm) 5 mmho/cm = 5 dS/m = 5000 μmho/cm.

Electrical conductivity, EC
E N D
Presentation Transcript
Electrical conductivity, EC A quick method to measure the salinity of water. EC is approximately one-tenth of the total dissolved cation, or anion concentration. EC units for salt tolerance: dS/m or mmho/cm not micromho/cm (μmho/cm) 5 mmho/cm = 5 dS/m = 5000 μmho/cm
Excess salinity increases the energy plants must expend to grow: when levels are excessive, plant growth rates and yields are reduced. The salinity of the soil water reduces crop growth if the average rootzone salinity, (ECe), exceeds the threshold level for the crop.
Saturation extract electrical conductivity, ECe Soil Surface ECiw Average Rootzone Salinity, ECe Bottom of the rootzone
YIELD RESPONSE TO SALINITY Average Rootzone Salinity, ECe 100 % Threshold salinity Crop Yield Slope 0 %
McNeal and Coleman, 1966California Soils The data obtained by McNeal is in reasonable agreement with the TEC function of Quirk and Schofield
From hydraulic conductivity to infiltration -- from within the soil to the soil surface. Impact of water drops, rapid soil wetting, overland water flow cause physical disintegration of soil aggregates, clay dispersion and compaction at the soil surface.
Infiltration rates are particularly sensitive to salinity and SAR At the soil surface both are closely linked to the SAR and salinity of the irrigation water. At the soil surface, the EC and SAR of the soil quickly approaches that of the irrigation water.
Rainfall -- major hazard • Rainfall coupled with irrigation with low sodicity waters (5 < SAR < 10) may cause enhance runoff and erosion. • Fresh organic matter content and crop/stubble cover can be expected to compensate (somewhat) the effect of rainfall on soils irrigated with low sodicity waters. • Available data indicate these effects can not be predicted – be a good observer/manager.
SAR: When SAR > 13, permeability is greatly reduced because Na+ causes clays to repel and line up, greatly reducing infiltration and porosity (structure). SAR >13: Clays repel each other and line up Poor aeration, infiltration Sodic soils SAR <13: Clays attract each other and stack on end Good aeration, infiltration
Sodicity Measurement • Sodium Adsorption Ratio (SAR) • C's have units of moles of charge per cubic meter (meq/L valence)
Potential for infiltration problems due to high Na+ water. EC = 0.40 mmho/cm SAR = 8.2
Leaching Fraction, L L = Dd/Di = Ci/Cd = ECi/ECd L = Leaching fraction D = Water depth C = Water mineral concentration (TDS) EC = Water electrical conductivity i = Irrigation water (consistent units: in/in, d = Drainage water ppm/ppm, dS/m/dS/m)
Leaching Requirement, Lr Lr = Leaching requirement (i.e., the leaching fraction required) There are simple models which estimate the amount of leaching required to maintain an acceptable level of soil salinity, based on a linear distribution of accumulated salts in the root zone.
Lr when ECi = 2.40 dS/m and T = 2.5 dS/m Lr = 0.17
Micro-Irrigation • Subsurface drip irrigation • Surface drip irrigation • Micro sprinklers