Download
1 / 19
200 likes | 527 Views
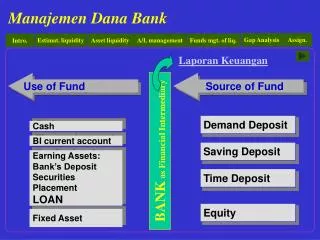
Laporan Keuangan. Cash. BI current account. Earning Assets: Bank’s Deposit Securities Placement LOAN. Fixed Asset. Use of Fund. Source of Fund. Demand Deposit. BANK as Financial Intermediary. Saving Deposit. Time Deposit. Equity. Use of Fund. Interest ?. Cost of Fund. Matched ?.

E N D
Laporan Keuangan Cash BI current account Earning Assets: Bank’s Deposit Securities Placement LOAN Fixed Asset Use of Fund Source of Fund Demand Deposit BANK as Financial Intermediary Saving Deposit Time Deposit Equity
Use of Fund Interest ? Cost of Fund Matched ? Maturity ? Liquidity Sources of Fund Asset and Liability Management the set of actions and procedures designed to control the bank’s risks and financial position
Sources and Uses of Funds Method: Calculate future changes over time in loans and deposits from past experience and future expectations. Example of estimation: Estimating liquidity needs
Structure-of-Deposits Method: Example of estimation: Estimating liquidity needs
Funding and market liquidity needs Funding-liquidity risk refers to maintaining sufficient cash to meet investment needs. Market-liquidity risk is related to market disruptions that can temporarily widen bid-ask spreads and make it difficult to close out open positions in derivatives, securities, etc. without sustaining losses. General definition of liquidity: Amount of liquidity needed relative to ability to meet liquidity demands. Estimating liquidity needs
Role of asset liquidity Liquid assets are an alternative source of funds. A reserve to protect the bank from financial market loss of confidence that could threaten safety and soundness. Primary reserves -- vault cash and cash held on deposit at the Federal Reserve district bank. Secondary reserves -- money market instruments held by the bank under no formal regulatory requirements. Asset liquidity
Primary reserves Lagged reserve requirements Calculate daily average balances of transactions deposits during a 14-day period (computation period). Calculate average daily vault cash in the next 14-day period. Skip 3 days. Maintain reserve balances at the Federal Reserve during a subsequent 14-day period (maintenance period). Thus, 17 days between end of computation period and beginning of maintenance period. LRR lowers management costs and improves the quality of information on required balances. Asset liquidity
Managing the money position (minimize cash holdings which generally means to meet reserve requirements). Asset liquidity
Secondary reserves T-bills, Federal agency securities, repurchase agreements (RPs or Repos), bankers’ acceptances, negotiable certificates of deposit (CDs), federal funds, and commercial paper. Aggressive liquidity approach Yield curve relationships can be used to buy longer-term or short-term securities (e.g., 30-day 2-year securities). Securitization of loans (asset-backed financing) Loans are converted to securities with greater liquidity. Credit risk is reduced. Asset management
Asset/liability committee (ALCO) In general, a short-run management tool: Construct a sources and uses of funds statement. NIMs are controlled by this management: Example: $100 million 5-year fixed-rate loans at 8% = $8 million interest $90 million 30-day time deposits at 4% = $3.6 million interest $10 million equity Net interest income = $4.4 million Net interest margin (NIM) = ($8 - $3.6)/$100 = 4.4% If interest rates rise 2%, deposit costs will rise in next year but not loan interest. Now, NIM = ($8 - $5.4)/$100 = 2.6%. Thus, NIM depends on interest rates, the dollar amount of funds, and the earning mix (rate x dollar amount) Asset/Liability management
Purchase the funds needed to meet loan demands and deposit withdrawals. Correspondent balances of smaller banks with larger banks. Risks Interest rate increases reduce interest rate margins. Capital losses on securities and other assets can occur as interest rates increase. Loss of public confidence would prevent the bank from rolling over purchased funds. Increased borrowing causes financial risk to increase (i.e., variability of earnings per share). Capital market risk can occur when interest rates are low and investors shift funds from deposits to higher earning capital assets in the financial marketplace. Liability management
Compare the total liquidity needs to total liquidity sources. Liquidity ratios Loans/deposits Loans/nondeposit liabilities U.S. government securities/nondeposit liabilities U.S. government securities/large denomination time deposits Liquid assets and liabilities in period t/estimated liquidity needs in period t (i.e., liquidity relative to needs) Optimum bank liquidity Balance risks and returns … high enough liquidity to meet unexpected needs but not so high to incur high opportunity costs of near-cash assets. Uncertainty in forecasted needs and sources affects optimum also. Funds management of liquidity
Regulatory view of bank liquidity Adequacy of bank liquidity (not least cost or optimum liquidity strategy). The availability of assets readily convertible into cash The structure and volatility of deposits The reliance on interest-sensitive funds The ability to sustain any level of borrowings over the business cycle The bank’s formal and informal commitments for future lending The ability to adjust rates on loans when rates on interest-sensitive sources of funds fluctuate The examiner-analyst Funds management of liquidity
RSA($) - RSL($) (or dollars of rate sensitive assets minus dollars of rate sensitive liabilities -- normally, less than one-year maturity). To compare 2 or more banks, or make track a bank over time, use the: Relative gap ratio = Gap$/Total Assets or Interest rate sensitivity ratio = RSA$/$RSL$. Positive dollar gap occurs when RSA$>RSL$. If interest rates rise (fall), bank NIMs or profit will rise (fall). The reverse happens in the case of a negative dollar gap where RSA$<RSL$. A zero dollar gap would protect bank profits from changes in interest rates. Dollar gap
Gap, interest rates, and profitability: The change in the dollar amount of net interest income (NII) is: NII = RSA$( i) - RSL$( i) = GAP$( i) Example: Assume that interest rates rise from 8% to 10%. NII = $55 million (0.02) - $35 million (0.02) = $20 million (0.02) = $400,000 expected change in NII Defensive versus aggressive asset/liability management: Defensively guard against changes in NII (e.g., near zero gap). Aggressively seek to increase NII in conjunction with interest rate forecasts (e.g., positive or negative gaps). Many times some gaps are driven by market demands (e.g., borrowers want long-term loans and depositors want short-term maturities. Dollar gap
While GAP$ can adjust NIM for changes in interest rates, it does not consider effects of such changes on asset, liability, and equity values. DGAP (duration gap) = DA - W DL, where DA is the average duration of assets, DL is the average duration of liabilities, and W is the ratio of total liabilities to total assets. DGAP can be positive, negative, or zero. The change in net worth or equity value (or E) here is different from the market value of a bank’s stock (which is based on future expectations of dividends). This new value is based on changes in the market values of assets and liabilities on the bank’s balance sheet. Duration Gap
EXAMPLE: Balance Sheet Duration Assets $ Duration (yrs) Liabilities $ Duration (yrs) Cash 100 0 CD, 1 year 600 1.0 Business loans 400 1.25 CD, 5 year 300 5.0 Total liabilities $900 2.33 Mortgage loans 500 7.0 Equity 100 $1,000 4.0 $1,000 DGAP = 4.0 - (.9)(2.33) = 1.90 years Suppose interest rates increase from 11% to 12%. Now, % E = (-1.90)(1/1.11) = -1.7%. $ E = -1.7% x total assets = 1.7% x $1000 = -$17. Duration Gap
Duration Gap • Defensive and aggressive duration gap management: • If you think interest rates will decrease in the future, a positive duration gap is desirable -- as rates decline, asset values will increase more than liability values increase (a positive equity effect). • If you predict an increase in interest rates, a negative duration gap is desirable -- as rates rise, asset values will decline less than the decline in liability values (a positive equity effect). • Of course, zero gap protects equity from the valuation effects of interest rate changes -- defensive management. • Aggressive management adjusts duration gap in anticipation of interest rate movements.
TUGAS • Buat kelompok dengan jumlah anggota 2-3 orang • Membawa contoh laporan keuangan lengkap sebuah bank • Buatlah analisis laporan keuangan, khusus mengenai likuiditas. • Hasilnya dipresentasikan dan didiskusikan pada pertemuan ke-3 • Hasil analisis selengkapnya disajikan dalam bentuk paper yang dikumpulkan paling lambat sebelum mata kuliah ini