
Review
Review. Microeconomics. Macroeconomics. Economy Economics Because of scarcity and opportunity costs we need to take optimal decisions: WHWWW? Who makes the Decisions? HH, Firm, Govt Where do they make these decisions? Market

Review
E N D
Presentation Transcript
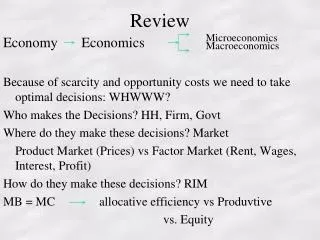
Review Microeconomics Macroeconomics Economy Economics Because of scarcity and opportunity costs we need to take optimal decisions: WHWWW? Who makes the Decisions? HH, Firm, Govt Where do they make these decisions? Market Product Market (Prices) vs Factor Market (Rent, Wages, Interest, Profit) How do they make these decisions? RIM MB = MC allocative efficiency vsProduvtive vs. Equity
Opportunity cost • From our definition of economics, we know that when we make choices, we face costs • Definition: Opportunity cost is the cost in choosing in the face of scarcity - it is the value of the benefit that is forgone by choosing one alternative rather than another.
Opportunity Cost II • Note: 1) Opportunity cost is NOT money cost 2) Opportunity cost includes the value of time 3) Opportunity cost does not always remain the same Note: The principle of substitution states that, as opportunity costs change, individuals may choose to substitute one action for another action that has a lower opportunity cost.
Production • 2 types of production - goods and services Total Production Goods Services Capital Consumer Durable Non-Durable How can we better illustrate this trade off?
Production Possibilities: An example • Assumptions made: 1) only 2 goods produced (all the rest held constant by ceteris paribus condition) 2) A fixed level of technology and fixed amount of the factors of production are present.
Suppose this firm (Firm A) can produce either cars or SUVs at the following ratio: CARS SUVs A. 0 100 B. 50 75 C. 100 50 D. 150 25 E. 200 0 • These figures represent the maximum quantities of each combination.
Cars PPF for Firm A E 200 C 100 A 0 SUVs 100 50
PPF and Opportunity Cost • Here, we see that we have a linear PPF - this implies a constant slope of the PPF. • Slope = (D cars)/ (D SUV) = (-50)/ 25 = -2cars/SUV • Question: How do we show opportunity cost from this?
Opportunity Cost • Opportunity cost = “Give up” “Get” • So, if company moves production from E => D, what is the opportunity cost of: • 1) SUVs in terms of cars? • 2) cars in terms of SUVs?
Specialization and the PPF • By specialization, we mean that these factors are relatively more productive in some activity than others • PPF are not always linear - can be “bowed outward”
Increasing Cost PPF Cars Z Y X 0 SUVs
Efficiency and the PPF • Definition A certain allocation is “technically efficient” if there is no way for one good to be increased in quantity without lowering the other good. • How does this relate to the PPF? • Is point X efficient? Is point Y efficient?
Efficient Production • Thus, we could say that points ON the PPF are characterized by • 1) full utilization of the factors of production • 2) factors are being used efficiently • A violation of either of these 2 properties will result in a combination that lies INSIDE of the PPF.
Economic Growth Shifting of the PPF
Cars How can we get to point Z from a production standpoint? Z Y X 0 SUVs
Economic Growth • Recall, economic growth - this can be shown by an outward shift of the PPF 2 key factors of economic growth - 1) Technical Progress 2) Capital accumulation **Capital goods vs. consumption goods trade-off • What would a shift inward of the PPF represent??? • What might cause this??
Multiple Plant Production • Suppose the firm producing cars/SUVs has another plant(plant B). It employs the same amount of resources as does the first plant (plant A we talked about earlier) and follows this production schedule: CARS SUVs 0 100 25 75 50 50 25 75 100 0 Which plant has the lowest cost of producing (additional) SUVs? Of producing (additional) cars?
From plant A: • Opportunity cost of SUV: 2 cars • Opportunity cost of car: 1/2 SUV • In plant B: • Opportunity cost of SUV: 1 car • Opportunity cost of car: 1 SUV Thus, lowest cost of SUV ------ PLANT B Lowest cost of car------- PLANT A If I want to produce 125 SUVs, which plant should produce how much??? What if I want to produce 125 cars???
Comparative Advantage • This difference in costs leads to the notion of comparative advantage Definition: A person has a comparative advantage in an activity if she can perform that activity for a lower cost than any other person. This applies to nations, firms, economies, etc. and the activity is usually production. Thus, in our case, Plant_____has a comparative advantage in the production of cars and Plant ____ has a comparative advantage in the production of SUVs.
Comp Adv. And Specialization • If production is efficient, then comparative advantage leads to specialization in production Examples: Adam Smith’s pin factory Assembly-line at auto plant Nations: Nepal vs. United States • Specialization leads to greater quantities produced • Specialization can be seen in the PPF as well.


