Amplitude, Reflection, and Period
Amplitude, Reflection, and Period. Trigonometry MATH 103 S. Rook. Overview. Section 4.2 in the textbook: Amplitude and Reflection Period Graphing y = A sin B x or y = A cos B x. Amplitude and Reflection. Amplitude.

Amplitude, Reflection, and Period
E N D
Presentation Transcript
Amplitude, Reflection, and Period Trigonometry MATH 103 S. Rook
Overview • Section 4.2 in the textbook: • Amplitude and Reflection • Period • Graphing y = A sin Bx or y = A cos Bx
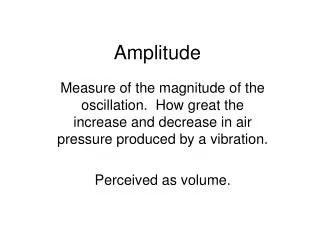
Amplitude • If a given graph has both a minimum value mAND a maximum value M, then the amplitude is • Only the sine and cosine graphs possess this property • The minimum and maximum value for both y = cos x and y = sin x is -1 and 1 respectively • Thus the amplitude for y = sin x and y = cos x is
Range of the Sine and Cosine Functions • Recall that the range is the allowable set of y-values for a function • We just observed that the minimum value is -1 and the maximum value is 1 for y = sin x and y = cos x i.e. -1 ≤ y ≤ 1 • For both y = sin x and y = cos x: • Domain: (-oo, +oo) • Range: [-1, 1]
How Amplitude Affects a Graph • The graphs of y = A sin x and y = A cos x are related to the graphs y = sin x and y = cos x: • Each y-coordinate of y = sin x or y = cos x is multiplied by A to get the new functions y = A sin x or y = A cos x • E.g. (0, 1) on y = cos x would become (0, 5) on the graph of y = 5 cos x • Amplitude = |A| • Always positive • The maximum value is |A| and the minimum value is -|A| • The range of y = A sin x or y = A cos x is then [-|A|, |A|]
How Amplitude Affects a Graph (Continued) • If 0 < A < 1 y = A sin x or y = A cos x will be COMPRESSED in the y-direction as compared to y = sin x or y = cos x • If A > 1 y = A sin x or y = A cos x will be STRETCHED in the y-direction as compared to y = sin x or y = cos x • The value of Aaffects ONLY the y-coordinate • The value of Adoes NOT affect the period • e.g. y = sin x and y = 4 sin x both have period 2π
Graphing y = A sin x or y = A cos x • To graph one cycle of y = A sin x or y = A cos x: • Divide the interval from 0 to 2π into 4 equal subintervals: • The x-axis will be marked by increments of π⁄2 • The y-axis will have a minimum value of -|A| and a maximum value of |A| • We can use so few points because we know the shape of the sine or cosine graph! • Create a table of values • Based on the values labeled on the x-axis • Connect the points to make the graph • Based on the shape of either the sine or cosine graph
Amplitude (Example) Ex 1: Sketch one complete cycle: a) y = 3⁄4 sin x b) y = 5 cos x
Reflection • If A < 0 y = A sin x or y = Acosx will be reflected about the x-axis • Recall that multiplying the y-coordinate of a point by a negative value reflects the point over the x-axis • E.g. (3, 2) reflected over the x-axis becomes (3, -2) Amplitude = |A| • Maximum value is still |A| and minimum value is still -|A| • Repeat the EXACT same steps to graph y = A sin x or y = Acosx when A < 0
Reflection (Example) Ex 2: Sketch one complete cycle: y = -3 cos x
Introduction to How the Argument Affects the Period • Recall that informally the period is the smallest interval until the graph starts to repeat • The period of both y = sin x and y = cos x is 2π • Now we will consider the effects of multiplying the argument (input) by a constant B • i.e. How is y = sin Bx or y = cos Bx different from y = sin x or y = cos x? • Note that in the case of y = sin x or y = cos x, B = 1
How Period Affects a Graph • Consider graphing y = sin x, y = sin 2x, and y = sin 4x using a table of values • Notice that, on the interval 0 to 2π, y = sin x makes 1 cycle, y = sin 2x makes 2 cycles, and y = sin 4x makes 4 cycles • The period of y = sin x is 2π, the period of y = sin 2x is π, and the period of y = sin 4xis π⁄2
How Period Affects a Graph (Continued) • To establish a relationship between y = sin x and y = sin Bx or y = cos x and y = cos Bx: • When B = 1, the graph makes 1 cycle in the interval 0 to 2π and the period is 2π • When B = 2, the graph makes 2 cycles in the interval 0 to 2π and the period is π (divide by 2) • When B = 4, the graph makes 4 cycles in the interval 0 to 2π and the period is π⁄2 (divide by 4)
Relationship Between B and Period • Therefore, for y = sin Bx or y = cos Bx: • To graph one cycle, we repeat the same steps for graphing y = A sin x or y = A cos xEXCEPT: • The period may NOT necessarily be 2π • Divide the interval between 0 and the period into 4 equal subintervals • 4 is not a “magic number” but an easy number to utilize in the calculations – will always get 0, π⁄2, π, 3π⁄2, 2π • The value of Baffects ONLY the x-coordinate • The value of Bdoes NOT affect the amplitude
Period (Example) Ex 3: Sketch one complete cycle: y = cos 2x
Graphing y = A sin Bx or y = A cos Bx • Given y = A sin Bx or y = A cos Bx: |A| is the amplitude is the period • To graph y = A sin Bx or y = A cos Bx: • Calculate the amplitude and period • Graph one cycle by dividing the interval from 0 to the period into 4 equal subintervals • We will discuss intervals OTHER THAN 0 to the period when we discuss phase shift in the next lesson • Textbook refers to this as “Constructing a Frame” • Extend the graph as necessary
Graphing y = A sin Bx or y = A cos Bx (Example) Ex 4: Graph over the given interval:
Graphing y = A sin Bx or y = A cos Bx (Example) Ex 5: Give the amplitude and period of the graph:
Summary • After studying these slides, you should be able to: • Graph a sine or cosine function for any amplitude and period • Identify the amplitude and period of a sine or cosine graph • Additional Practice • See the list of suggested problems for 4.2 • Next lesson • Vertical Translation and Phase Shift (Section 4.3)