Download
1 / 26
260 likes | 368 Views
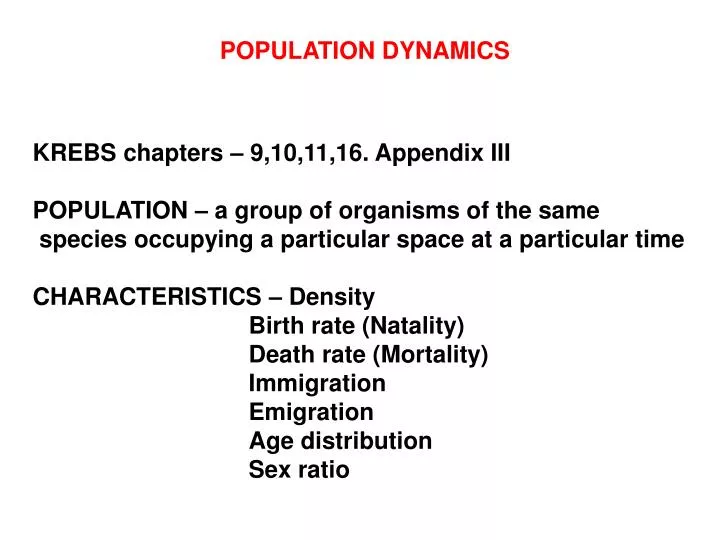
POPULATION DYNAMICS. KREBS chapters – 9,10,11,16. Appendix III POPULATION – a group of organisms of the same species occupying a particular space at a particular time CHARACTERISTICS – Density Birth rate (Natality) Death rate (Mortality) Immigration Emigration

E N D
POPULATION DYNAMICS KREBS chapters – 9,10,11,16. Appendix III POPULATION – a group of organisms of the same species occupying a particular space at a particular time CHARACTERISTICS – Density Birth rate (Natality) Death rate (Mortality) Immigration Emigration Age distribution Sex ratio
POPULATION DYNAMICS Density: Numbers / unit area Birth rate (Natality): numbers of offspring / unit time Can vary from once in a life time = SEMELPAROUS to many times = ITEROPAROUS
POPULATION DYNAMICS Death rate (Mortality): Converse of mortality is SURVIVAL LONGEVITY = length of life SURVIVAL can be estimated by measuring relative abundance of two age groups provided (i) number entering first age group and (ii) survival are both constant
POPULATION DYNAMICS Immigration and Emigration are aspects of DISPERSAL SOURCE populations – births are greater than deaths and So export individuals = emigration SINK populations – births less than deaths so numbers are maintained only by importing individuals = immigration Dispersers link populations. METAPOPULATION = a collection of subpopulations
LIFE TABLES LIFE TABLE – is an age-specific summary of the birth and death rates operating on a cohort of individuals COHORT – a group of organisms born in the same time period
LIFE TABLES Age interval can be any unit e.g. year, month, week LIFE TABLE – e.g. song sparrow population Cohort is described by x = age nx = number of survivors at age x lx = proportion surviving from birth to start of age x dx = number dying during interval x to x+1 qx = age-specific mortality = proportion dying during age interval x to x=1
LIFE TABLES Age interval can be any unit e.g. year, month, week nx = number of survivors at age x lx = nx / n0 dx = nx – nx+1 qx = dx / nx
SURVIVORSHIP CURVES
FECUNDITY • after maturity • reproduction • continues through • life
U.S. WOMEN 1989 FECUNDITY Human females stop reproducing at about 45 yrs
COHORT LIFE TABLE – is the schedule of deaths of a group born at a given time and followed through life. TIME SPECIFIC LIFE TABLE – is a cross-section of all cohorts represented by the frequency of the different ages in a population at a given moment in time
Time specific Life table Cohort Life table Age Birth t1 t2 t3 t0 Time
TIME SPECIFIC and COHORT LIFE TABLES
STABLE AGE DISTRIBUTION – occurs when survivorship (lx) and age-specific births (bx) are constant in each cohort STATIONARY AGE DISTRIBUTION – a special case of stable age distribution in that the population is stationary because births and deaths are equal
STATIONARY AGE DISTRIBUTION -occurs when r = 0 and b = d
STABLE AGE DISTRIBUTION FROM LIFE TABLE Survivorship Reproduction
STABLE AGE DISTRIBUTION FROM LIFE TABLE Survivorship Reproduction
STABLE AGE DISTRIBUTION FROM LIFE TABLE Survivorship Reproduction
STABLE AGE DISTRIBUTION FROM LIFE TABLE Survivorship Reproduction
STABLE AGE DISTRIBUTION FROM LIFE TABLE Survivorship Reproduction
STABLE AGE DISTRIBUTION FROM LIFE TABLE Survivorship Reproduction
STABLE AGE DISTRIBUTION FROM LIFE TABLE TOTAL POPULATION
STABLE AGE DISTRIBUTION Survivorship Fecundity