Download
1 / 9
90 likes | 196 Views
CERN, FiDeL meeting, 15 th February 2011. Chromaticity during injection. Nicholas Aquilina TE-MSC-MDA Acknowledgements : E. Todesco, W. Venturini, EIC and operators. Contents. Measurements of chromaticity during injection

E N D
CERN, FiDeL meeting, 15th February 2011 Chromaticity during injection Nicholas Aquilina TE-MSC-MDA Acknowledgements: E. Todesco, W. Venturini, EIC and operators
Contents • Measurements of chromaticity during injection • Post-processing of data in order to get the bare chromaticity of the machine removing the chromaticity trims • Fitting of the data with FiDeLparametrization • Proposal for the average correction
Measurements and trims • The value of the chromaticity is obtained from the logbook (as done by [W. Venturini]) • Unfortunately there is no chromaticity measurement during injection in TIMBER • The trims can be obtained: • from the logbook • from TIMBER; currents in MCSF/MCSD
Chromaticity decay • Chromaticity decay as obtained by W. Venturini • Note the two different families of decay • In this case the trims were being obtained from the logbook Horizontal chromaticity versus time at injection, beam1 (blue), beam2 (red) [W. VenturiniDelsolaro]
Chromaticity decay • The chromaticity measurement was taken from the logbook without taking note of the trims • Instead the trims were obtained from TIMBER • The bare chromaticity of the machine was then obtained by adding the trims to the measurements • Note how the data converged to one plot
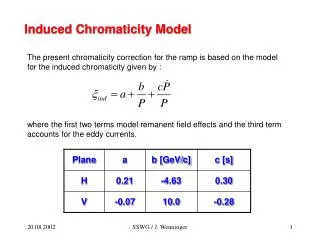
Fitting of the data • A double exponential1 of this form was used to model this decay • This model fits very well the chromaticity decay 1 N. Sammut, L. Bottura, and J. Micallef. Phys. Rev. ST Accel. Beams 9, 012402 (2006)
Fitting of the data where Q’h* and Q’v* are the starting bare chromaticity values as dictated by the machine optics
Average correction • Based on the fits shown in the previous slide the following corrections are suggested: suggested values • 1 taking 1 unit of b3 = 40 units of Q’ • 2 N. Sammut, L. Bottura, and J. Micallef. Phys. Rev. ST Accel. Beams 10, 082802 (2007) for a 50A/s ramp rate and IFT = 12kA • 3 parameters in FiDeL database since 2008, for a 10A/s ramp rate and IFT = 12kA, in fact c = 0.5 was used instead (since IFT = 6kA)
Conclusions • Chromaticity measurements during injection can be used to understand better the b3 decay behaviour • From this analysis it can be seen that the b3 decay is a factor of 5 slower than the expected value from the measurements done at SM18, however the decay amplitude is in line with these measurements • Injecting the beam as soon as possible once at injection will help to get a better model of the chromaticity during the first moments of the decay • Having more measurements of the chromaticity both during injection and ramping logged in TIMBER will be very helpful for further analysis