Download
1 / 6
60 likes | 74 Views
Frequency analysis is a technique to test the assumption that the individual outcomes of a lottery are equally likely. This is a common technique used for everything from food manufacturing to cryptoanalysis.

E N D
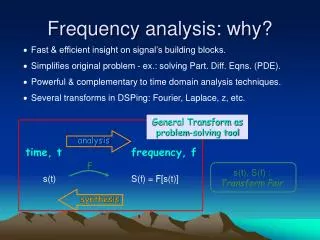
Introduction to FrequencyAnalysis
What Is Frequency Analysis Frequency analysis is a technique to test the assumption that the individual outcomes of a lottery are equally likely. This is a common technique used for everything from food manufacturing to cryptoanalysis. Performing frequency analysis is as simple as counting the number of times that an outcome is observed, dividing that by the total number of observations, and comparing the result to what we would expect.
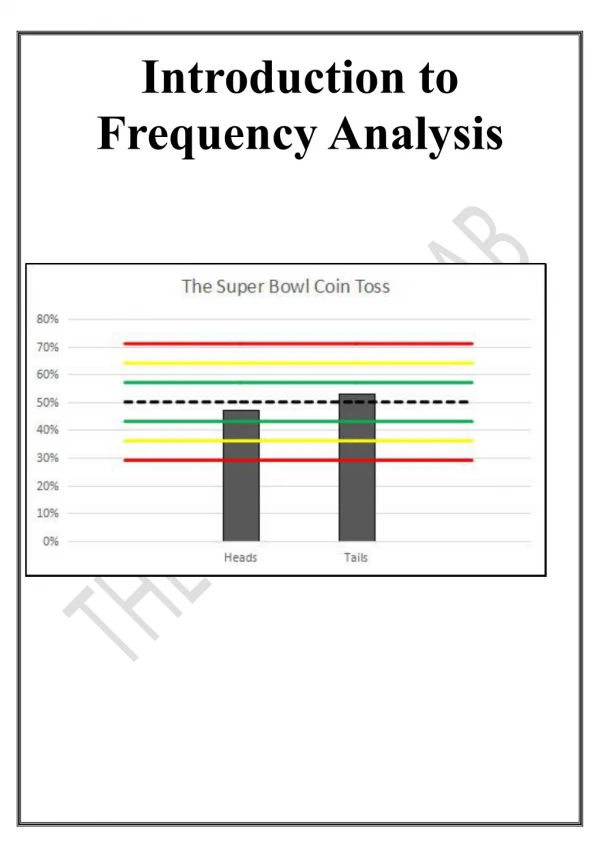
How Frequency Analysis In Lottery Results Works As an introductory example, lets consider one of the most famous coin tosses of the year: The Super Bowl coin toss. For the last 25 years, the Super Bowl coin has been produced by the Highland Mint of Melbourne, Florida and every year Las Vegas gamblers wager hundreds of thousands on this simple bet. So, we have to ask: Is the Super Bowl coin a “fair” coin? Is it as likely to come up heads as it is to come up tails? Las Vegas oddsmakers certainly believe that the coin toss is fair because they offer even odds on the wager. But over the last 51 Super Bowls, the coin has only come up heads 24 times while it has come up tails 27 times. That means heads has only occurred 47% of the time while tails has occurred 53% of the time. This is where oddsmakers apply frequency analysis to test if the data has deviated from what we would have expected for a fair coin. In theory, we expect a fair coin to come up heads 50% of the time. In practice, we know that no coin can be guaranteed to come up heads 50% of the time (particularly if we flip it an odd number of times). The gap between theory and practice is the number of times that the coin is flipped. Theory is based on an infinite number of coin flips, while our actual experience is based on a limited number of coin flips. Statisticians, engineers, and oddsmakers therefore take the observed frequency of an outcome and the number of observations into account when determining if a process is “fair”. A popular tool for managing this information is a “control chart”. The figure below shows the control chart for the Super Bowl coin toss data.
Control charts consist of three key elements. First, the expected probability is shown as a dotted line. Since, the expected probability for head or tails with a fair coin is 50%, the dotted line is at 50%. The second key element consists of a set of control limits. If you have ever heard someone talking about “Six Sigma”, they are talking about these control limits and their use in statistical process control. If you are interested in the math behind determining control limits, see this post . To make the most of control limits, oddsmakers and statisticians take a perspective that might seem unusual at first. They treat the observed data as a single outcome from the universe of all possible experiments where 51 fair coins are flipped. Based on that perspective, they expect that 68% of all outcomes would land between the green lines. Similarly, we expect 95% of all outcomes between the yellow lines and 99.7% of all outcomes between the red lines. The third and most obvious element of a control chart is the observed frequencies of each outcome. In the control chart above, heads have been observed 47% of the time while tails have been observed with frequency 53%. Since these outcomes fall well within the green zone, we can see why oddsmakers treat the Super Bowl coin toss as fair even if the observed frequency is not exactly 50/50. Frequency analysis and control charts can be applied to lottery data very easily. While the math is slightly more complicated, the intuition is the same. Below we see a chart from TheLotteryLab.com for Missouri’s Pick4. Although there is a total of four machines in this lottery, we are focused on the first one. Since the Pick4 is a “numbers game” or “digit game”, each machine has ten balls numbered from 0-9 and only one ball is selected in each drawing. As with any control chart, we have a dotted line which shows the expected frequency for each ball. Here it is 10% because we are drawing one of ten balls. The dataset that we are analyzing consists of 1,000 drawings which give us control limits spaced about every 1%.
There are a number of interesting features in this data. First, notice that there are two balls (4 and 8) which have fallen into the red zone. Additionally, there are only four balls that land in the green zone when we would expect six or seven. This suggests that Machine 1 may have deviated from expected behavior. Let’s contrast the results of Machine 1 with the results from Machine 2 (shown below). Here, ball number 5 is in the red zone, but the majority of balls are landing within the green zone. This suggests that Machine 1 has deviated from expected results more significantly than Machine 2. If you are interested in a quick and useful assessment of whether a machine is deviating from expected results, see our explanation of the chi squared test.
Contact Us 2812 Noble Fir Court Woodbridge, VA 22192 (Pincode) , USA Contact Us:- 814-207-2808 Website: https://www.thelotterylab.com/ Blog: https://blog.thelotterylab.com/