Displaying Your Data: Visualizing with Bar Charts
Learn about bar charts, their purpose, and when to use them to display data frequency. Gain insights from sample bar charts and run charts to track process performance. Understand the steps to create, interpret, and analyze charts effectively.

Displaying Your Data: Visualizing with Bar Charts
E N D
Presentation Transcript
Displaying your Data: QI Data Tools MIECHV Grantee Meeting June 6, 2014
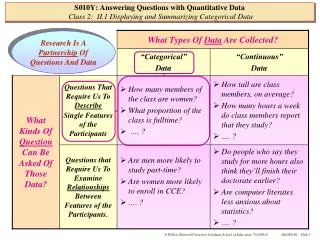
Bar Charts: Purpose & When to Use • Purpose • A tool to display how often/frequently something occurs • When to Use • When you want to display the relative frequency of different items • Examples of Data to Chart • Data from a database • Data from a survey • Data from a check sheet • Administrative data • Etc.
Sample Bar Chart Title x-axis y-axis
What does your Bar Chart tell you? • At first glance, what do you notice? • Which bar is shortest? Longest? Why might this be? • Indicates the item with the least and most frequency • Do different groups have a different pattern? • What might this tell us? • What changes do you notice over time by category? • What might this tell us? • What questions do these graphs leave unanswered? • Are there ways to change the graphs to better answer these questions?
A Few Tips • Make sure your team is in agreement regarding what data you would like to chart. • Don’t forget to label your chart! • Title • Horizontal axis (x-axis) • Vertical axis (y-axis) • Be sure to check your chart for accuracy. • Don’t forget to study and discuss the results of your chart!
Run Charts: Purpose • To study data measured over time • Run charts help to: • Study the performance of a process • Identify trends • Measure change in performance following a change in process Guidebook, 2nd Edition, page 68 Memory Jogger, page 125
Run Charts: When to Use • When you have, or can collect: • Quantitative data • On the measure of the performance of a process • Over time • Example • Sunny County Nurse Family Partnership program wants to increase the number of referrals it receives each month. In order to ensure that the referral process is stable, they use a run chart to examine changes from month to month in the number of referrals they receive.
Run Charts: Step by Step • Step 1 • Decide what data you need • Are the data you need already tracked? • Do the data need to be collected? • Determine the timeframe and number of data collection points • Should you make your count annually, quarterly, monthly, weekly, daily, hourly? • Try to gather data from 20+ time points in order to establish a trend • Step 2 • Gather your data
Run Charts: Step by Step • Step 3: • Graph your data • On the Y-axis, set up a scale that corresponds with your measure • On the X-axis, set up a scale that corresponds with your measurement timeframe • Plot your data on the chart, placing one dot at each measurement point • Draw a line through your dots • Calculate the mean score and draw a line at the mean • Mark the timing of your change • Excel, Word, and other programs can help! • For example…
Run Charts: Step by Step • Step 4: • Make sense of your results by examining your data • Does the mean reflect an appropriate level of service or outcome of your process? • Is there a trend that should be investigated? • Do you see a shift in your data? Are there 8 or more consecutive points on one side of the center line? • Do you see a trend in your data? Are there six consecutive jumps in the same direction (up or down)? • Do you see a pattern in your data? Does a pattern recur eight or more times in a row? • Back to our example…
Run Charts: Hints and Tips • Every process will have some variation • Be cautious about assuming that variation from the average has meaning • Be sure to tack data over a long enough period of time • This will help you identify the true mean and the true level of variability within the process.
Next Steps, Questions, & Evaluations MIECHV Grantee Meeting June 6, 2014
Learning Collaboratives: Next Steps • Test improvement theories (If/Then Statements) through mid-August 2014 • Continue testing original theories if success has been achieved thus far • An additional theory can be tested during this time to see if you can make an even greater improvement • Develop new theories if success has not been achieved thus far • Consider theories other teams have used that have been successful
Learning Collaboratives: Next Steps • Submit revised Team Charter to your MPHI technical assistance provider no later than June 30, 2014 • Please note: revised Team Charter should be completed in its entirety when submitted. • MPHI technical assistance provider will provide feedback by July 15, 2014
Learning Collaboratives: Next Steps • By August 25, 2014: • Complete PDSA cycle • Complete Story Board for PDSA cycle and send to MPHI technical assistance contact • MPHI technical assistance contact will: • Provide feedback on Story Board by September 2, 2014 • Final, revised story boards are due no later than September 8, 2014 • Story Boards will be printed and brought to final Grantee Meeting on September 18th for project sharing
Wrap-up • Questions • Evaluations • Technical Assistance Contact Information • EHS and HFA Programs • Contact: Robin VanDerMoere • rvanderm@mphi.org • 517.324.8380 • NFP Programs • Contact: Angela Precht • alewispr@mphi.org • 517.324.7343 Thank you!!