MAPPING OUR WORLD
370 likes | 403 Views
Learn about cartography, latitude, longitude, time zones, map projections, and how to find direction. Discover the science of map-making and the art of reading and interpreting maps accurately.

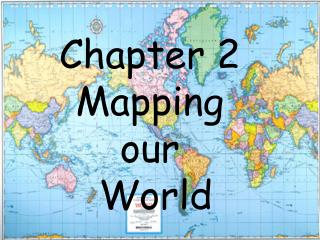
MAPPING OUR WORLD
E N D
Presentation Transcript
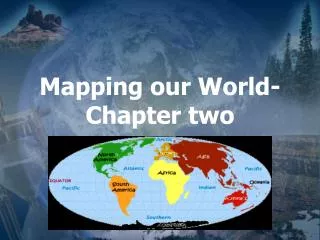
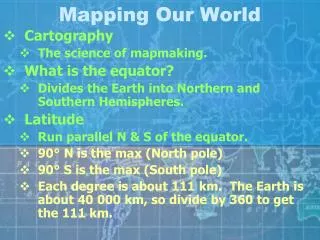
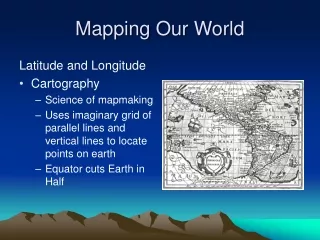
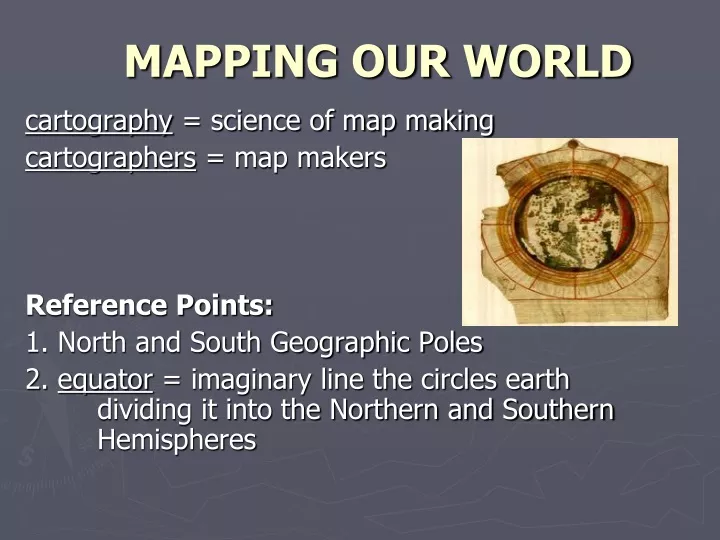
MAPPING OUR WORLD cartography = science of map making cartographers = map makers Reference Points: 1. North and South Geographic Poles 2. equator = imaginary line the circles earth dividing it into the Northern and Southern Hemispheres
latitude = angular distance north or south of equator 1. parallels = circles that run east and west around the world parallel to the equator 2. lines never meet or cross 3. areas are labeled as either N or S of the equator 4. equator = 0o latitude
5. all values fall between 0o to 90o a. North Pole = 90oN b. South Pole = 90oS 6. measured in degrees (more precise to give degrees, minutes, and seconds) a. 1 degree of latitude = about 111 km or 69 miles b. each degree has 60 equal parts = minutes (symbol: ‘) 1 minute of latitude = 1.85 km c. each minute has to equal parts = seconds (symbol: “) 1 second of latitude = 0.031 km (31m)
longitude = angular distance east or west of the prime meridian 1. meridian = half circle (semicircle) running from pole to pole 2. prime meridian = reference point for longitude a. represents 0o longitude b. passes through Greenwich, England 3. all values fall between 0o to 180o
4. can be expressed in degrees, minutes, and seconds a. distance covered depends on where the degree is measured b. farthest apart at equator and closest at the poles c. lines are not parallel 5. International Date Line = longitude opposite the prime meridian a. represents 180o longitude b. where east lines of longitude meet west lines of longitude
great circle = any circle that divides the globe into halves 1. formed by two meridians on opposite sides of the globe 2. equator is the only line of latitude which forms a great circle 3. can run in any direction around the globe 4. shortest distance between two points on a sphere
Time Zones: 1. sun basis for measuring time [12 noon - sun highest point in sky] 2. standard time zones = noon is set as time when sun is highest over center of each zone a. 24 zones - each 15o degrees wide b. 1 hour difference in each 3. at 12 midnight (AM) calendar advances to the next day in each time zone 4. crossing from one time zone to another causes local time changes by one hour a. traveling east → add one hour for each time zone b. traveling west → subtract one hour
5. International Date Line = transition line for calendar days a. traveling east across line → subtract one day (gain one day) b. traveling west across line → add one day (lose one day) 6. daylight savings time = plan where clocks are set one hour ahead of standard time for a certain number of months - usually begins first Sunday in April; ends last Sunday in October
Finding Direction: 1. magnetic compass = indicates direction due to earth’s magnetic properties 2. geomagnetic poles = points on earth’s surface just above the poles - different from geographic poles
3. magnetic declination = angle between the direction of geographic pole and direction in which compass needle points a. true north = direction of geographic North Pole b. determined for points all over earth c. by adjusting measurement of magnetic north one can determine geographic north for any place on earth
globe = spherical model of earth 1. locations of surface features and relative areas and shapes represented accurately 2. used in studying larger surface features
map = flat representation of earth’s curved surface 1. areas shown may be distorted in size, shape, distance and direction 2. larger the surface area being shown, greater the distortion map projection = flat map that represents three- dimensional curved surface of globe
TYPES OF MAP PROJECTIONS 1. Mercator projection a. distorts regions of land and sizes of areas near poles b. shapes of land and water bodies are correct c. both latitude and longitude lines are parallel and intersect at right angles d. used for navigation of ships and planes
2. conic projections: produce by projecting points & lines from globe on a cone a. produces accurate maps of small areas b. areas near contact are least distorted c. polyconic projections = series of projections used to map neighboring areas which are fitted together to make a continuous map d. includes road maps and weather maps
3. Gnomonic projection: produced by projecting points & lines from globe onto a piece of paper that touches the globe at a single point a. little distortion occurs at the point of contact b. distort both direction and distance increase as distance from point of contact increases c. used by navigators in plotting routes used in air & sea travel d. great circles will appear as straight lines
4. Robinson projection: a. has accurate continent shapes and land areas b. lines of latitude parallel while longitude is curved c. less distortion near the poles
5. polar projections: a. latitude lines appear as circles with smallest near the center b. circular rather than rectangular c. land areas near poles show in true proportions while those at equator are distorted d. used for countries around the Arctic Ocean
topography = shape of Earth’s surface topographic maps = show changes in elevation of Earth’s surface 1. natural features = mountains, hills, plains, lakes, and rivers - also called landscape features 2. cultural features (constructed) = roads, cities, and other structures built by people 3. provide more detailed information about the surface of an area
4. elevation = height/distance of a location above or below sea level a. measured from mean sea level = point midway between highest and lowest tide levels of the ocean b. mean sea level elevation = 0 c. all others are measured distances above or below mean sea level
5. contour line = connect points of equal elevation a. connect all points on a map that have the same elevation b. shape of line reflects shape of the land c. never cross d. will either close or extend to the edge of the map
6. contour interval = difference in elevation between two side by side contour lines a. determined by size of map and relief b. relief = difference in elevation between the highest and lowest points of area being mapped 1) high - large interval (50 m) [steep land] 2) low - small interval (5 m)
INTERPRETING TOPOGRAPHIC MAPS 1. topographic sheets (quadrangles) = detailed maps of all the United States created by USGS (United States Geological Survey) a. first quadrangles covered 15’ of latitude and 15’ of longitude b. new series covers 7.5’ latitude and 7.5’ longitude; smaller area but greater detail 2. symbols = show certain features a. different colors used for different types b. include: constructed features = black; major highways = red; bodies of water = blue; forested areas = green; contour lines = brown
3. direction a. follow line of latitude and longitude b. all parallels and meridians shown are labeled in degrees and minutes 4. distance a. refer to map scale b. most common = 1:24,000 (1 in. on map = 2,000 ft. on surface) c. can use ruler to measure distances on map and covert the inches to feet or miles
5. elevation a. index contours = lines marked with elevation 1) also called a bench mark 2) usually every fifth line, printed bolder than others b. points between two contour lines has an elevation somewhere between two lines c. exact elevations are marked by an “ x ” and labeled
6. landforms a. can determine shape b. lines far apart indicate gradual change, land relatively level c. lines close together indicate a rapid change in elevation or steep slope d. lines almost touching indicate a very steep slope or cliff
e. lines evenly spaced shows slope increases about the same over distances f. lines bend to form V-shape indicate a valley 1) points toward higher end of valley 2) points upstream if river or stream flows through valley (direction from which the water flows) 3) river always flow from higher to lower elevations a) steep course of river - lines close together when cross 4) width of valley shown by width of V
g. closed loops indicate a hilltop or depression 1) depression contours = marked with short, straight lines a) drawn on inside of loop and point toward center b) hachures = short lines at right angle to contour line c) always point toward the lower elevation (Ex: pg. 34 text)
7. profile = line that shows changes in elevation across a section of a topographic map 8. average slope, or gradient, between any two points can be determined from contour map average slope = change in elevation distance
Ex: A trail is 4 miles long based on the map scale. It begins at the 1060 ft. contour and ends at the 960 ft. contour. Calculate the average slope. avg. slope = 1060 ft.- 960 ft. = 100 ft. = 25 ft./mi. 4 mi 4 mi.
READING A MAP: 1. map legend = list of the symbols and their meaning 2. determine direction a. usually drawn with north at top, east at right, west at left, and south at bottom b. parallels run from side to side c. meridians run from top to bottom
3. map scale = relationship between distances on map and actual distances on Earth’s surface a. graphic scale = printed line divided into equal parts and labeled 1) line represents a unit of measure 2) to find actual distance between two points on earth a) first measure the distance between the points on the map b) compare that measurement with the scale
b. fractional scale = ratio of represented distance on map to actual distance on surface *two numbers must be in the same unit Ex: 1:5000000 [1 cm on map = 5 million cm (50 km) on earth] c. verbal scale = equates two different units Ex: 1 cm (map) = 1 km (on Earth)
remote sensing = process of collecting data about Earth from far above Earth’s surface 1. uses electromagnetic spectrum = arrangement of electromagnetic (EM) radiation based on wavelength a. frequency = number of waves that pass a particular point each second b. wavelengths, speeds, and frequencies of EM wave determine how energy is used by different satellites to map Earth
2. Landsat satellite = receives reflected wavelengths of energy emitted by Earth’s surface a. Earth’s surface features radiate warmth at slightly different frequencies b. features will show up different colors in map images c. scan entire surface of planet in 16 days d. show landforms in great detail; also used to study plate movement, rivers, earthquakes, and pollution
3. Topex/Poseidon satellite = uses radar to map ocean floor features a. emitter sends outgoing signal to ocean surface, receiver times returning signal, distance to surface is calculated using know speed of light and return time b. used to study tidal changes and global ocean currents
4. Global Positioning System (GPS) = radio-navigation system of at least 24 satellites that allows users to determine their exact position on Earth a. user’s receiver calculates user’s location by processing signals emitted by multiple satellites b. can also relay information about elevation, direction, and speed c. frequently used for navigation by airplanes & ships; popular among hikers and backpackers d. also used to detect earthquakes, create maps, track wildlife
5. Sea Beam = technology similar to Topex/Poseidon satellite a. located on a ship rather than on a satellite b. uses sonar (sound waves) to detect and measure objects underwater c. used by fishing fleets, deep-sea drilling operations, scientists Mid-Atlantic ridge