Download
1 / 16
170 likes | 194 Views
This study explores the growing relative delay bottleneck in optimized interconnects. It investigates the impact of wire scaling on interconnect delay using an experimental setup and different synthesis parameters. The results highlight the performance degradation and the need for topographical synthesis in modern technology libraries.

E N D
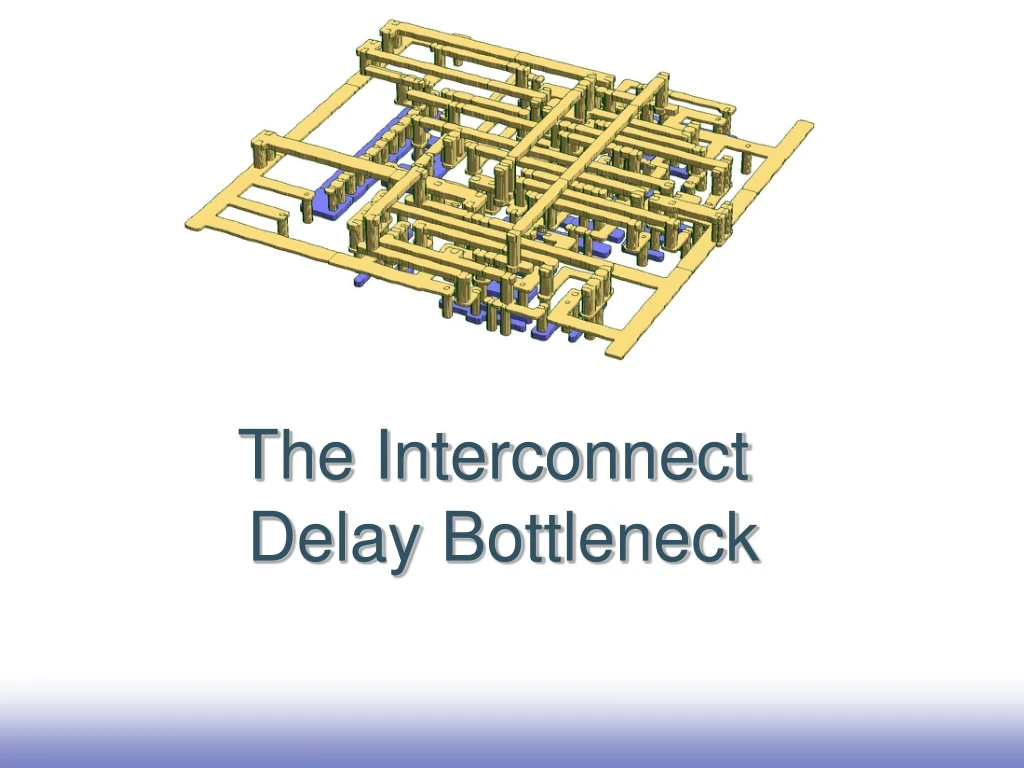
The Interconnect Delay Bottleneck
Relative delay is growing even for optimized interconnects Interconnect delay Wire delay does not scale with technology, literature says. Is it true?
ExperimentalSetup • The link performance was explored with an experimental setup consisting of • a 2-switch test architecture tuning the following physical synthesis parameters: • The link lengthspannedfrom 1.5mm to 10mm • Up to 9 pipeline stages inserted • The channel width ranged from 250um to 10um by means of non-routable obstructions. • Target frequency for synthesis: from 250MHz to 1Ghz. • Two technology libraries utilized: • Low-Power Low-Vth 65nm • Low-Power Std-Vth 45nm • (so that buffers have almost the same delay and the net impact of wire parasitics is pointed out) Switch 1 Switch 0 LINK LENGTH
Link Performance (1) SW 1 • The performance of the link degradesbyincrementing the inter-switchspacing • In 65nm even a loose target of 250MHz is not achieved for 8mm links while 1GHz is hardly affordable at 1.5mm. • In 45nm the synthesis tool does not achieve the 65nm performance even for the shorter links. SW 0 LINK LENGTH
Link Buffer Distribution • The place&route in 45nm has required a much higher number of buffer cells with high driving strength. • Physical properties of on-chip interconnects in 45nm are responsible for the performance degradation!
Link Performance (2) Let us now use a more modern synthesis flow based on placement-aware logic synthesis (hereafter named the “topographical synthesis”). SW 1 SW 0 • A relevant perfomance speedup is achievable by utilizing a topographical approach: • 45nm library outperforms 65nm library for long links and aggressive speeds • The awereness of back-end information becomes a must in 45nm and beyond LINK LENGTH
Link Pipelining The requirednumberof pipeline stagestomeet the target speedof 1Ghz on the link wasdeterminedwithincrementalplace&routesteps: • => Pipeline stages are insertedmanually so to break the link intosegmentsofequallength. Interestingly the trend for both the 45nm and 65nm library is the same! Switch 1 Switch 0
Gatedelay Let S be the scaling factor (S=0.7): Load capacitance Voltage swing of interest Device delay Drive current of the device
Gatedelay Shrinking of geometries Power and delay reduction Constant power density
Ideal scaling of MOS transistors Smaller interconnect yields larger delays due to the decreasing cross-sectional area L Very high level model which neglects sidewall coupling and fringing capacitances W H tdi E dielectric substrate There are two interconnect scaling scenarios: • Local interconnects (10-500 um at 0.18 um) (length scale set by the size of a gate) • Global interconnects (length scale set by functional unit size and chip edge)
Interconnect scaling Let S be the scaling factor (S=0.7): Ideal scaling: Horizontal and vertical dimensions are equally scaled to preserve packing density To preserve packing density For process integration For process integration Driven by gate shrinking Bad degradation! Tolerable RC stays constant in spite of the scaling trend Reliability problems
Interconnect scaling Improvement by means of: Quasi ideal scaling: wires scaled more in the horizontal rather than the vertical direction, so that: RC delay tracks S closer!! packing density preserved To preserve packing density To reduce resistance To keep capacitance limited Better than ideal scaling Should scale slightly, but sidewall capacitance accounted for. Tracks s closer Better
Interconnect scaling Ideal scaling: Horizontal and vertical dimensions are equally scaled to preserve packing density Increases with die size Degradation not tolerable
Interconnect scaling Improvement by means of: Constant dimension scaling: By maintaining wide and thick wires at the higher metal levels, RC delay can be controlled routing density penalized! Interconnect size unaffected Thanks to constant cross-section area Thanks to constant width and ILD Just the impact of increased wirelength. Much better!! But still this is a reverse scaling!!
A cross-layer concern • The physical-layer tricks documented above are complemented by other techniques to tackle the interconnect delay bottleneck: • Migration to new bus architectures • Link pipelining • Placement-aware logic synthesis