Demand Schedule
710 likes | 950 Views
Learn about the demand schedule and demand curve in economics, including factors that affect demand, shifts in the curve, and concepts like diminishing marginal utility.

Demand Schedule
E N D
Presentation Transcript
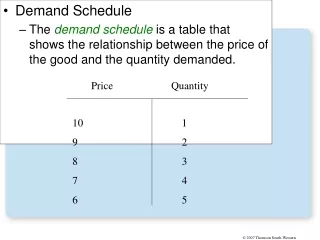
Demand Schedule The demand schedule is a table that shows the relationship between the price of the good and the quantity demanded. Price Quantity 10 9 8 7 6 1 2 3 4 5
1. A decrease in price ... 2. ... increases quantity of cones demanded. Figure 1 Catherine’s Demand Schedule and Demand Curve Price of Ice-Cream Cone $3.00 2.50 2.00 1.50 • The demand curve is a graph of the relationship between the price of a good and the quantity demanded. 1.00 0.50 Quantity of 0 1 2 3 4 5 6 7 8 9 10 11 12 Ice-Cream Cones
Demand Demand (D) the various amounts consumers are willing and able to purchaseat a series of possible prices at a given point in time Quantity Demanded (QD) the amountconsumers are willing and able to purchaseat a specific price at a given point in time.
Distinguishing Demand and Quantity Demanded P P QD QD Demand Quantity Demanded Only a part of the relation- ship. $5 4 3 2 1 $5 4 3 2 1 10 20 35 55 80 10 20 35 55 80 Entire relationship
B $2.00 4 Changes in Quantity Demanded A tax on sellers of ice-cream cones raises the price of ice-cream cones and results in a movement along the demand curve. Price of Ice-Cream Cones A 1.00 D 0 8 Quantity of Ice-Cream Cones
Shifts in the curve are caused by any change that alters the quantity demanded at every price. This product more people want to buy but not because the price went down. Look at the price and Quantities Notice the price stayed the same D Price 5 d2 d1 6 10 Quantity
D Price Price QD d2 d1 Quantity D1 Quantity Price Change Change in Demand Price QD D1 Quantity D Price d1 d2 Quantity
1."Change in Taste" [Direct] A decrease in taste forvideos results in a decrease in demand. An increase in taste for DVDs results in an increase in demand. D2 D1 D3 P QD3 QD1 QD2
Shifts in the Demand Curve • Consumer Income • As income increases the demand for a normal good will increase. • As income increases the demand for an inferior good will decrease.
The Impact of a Change in Income • Higher income increases the demand for a normal good • Higher income decreases the demand for an inferior good
3. Market Size (direct) (# of consumers) can increase/decrease from economic decisions, advertising, and government political decisions (China). Ex: The large “baby boom” of 1946-64 increased the demand for baby supplies. An increase in life expectancy increased demand for for medical care, retirement communities, and nursing homes. Increase in # of consumers
4. Expectations [of consumers] [about future price, availability, & income] If the iPod-Touch is expected to increase in price from $295 to $450. D2 D1 iPod-Touch P QD1 QD2
Shifts in the Demand Curve • Prices of Related Goods • When a fall in the price of one good reduces the demand for another good, the two goods are called substitutes. • When a fall in the price of one good increases the demand for another good, the two goods are called complements.
5. Prices of Related Goods [Substitues-Direct; Complements-Inverse] D1 D2 D D1 P1 D2 P P P2 Complement [Inverse] QD1 QD2 Substitute [Direct] Gangsta Grills Chrysler 300s Toyotas MV X PQ
[Decreasein price of one; increase in the “D” for the other] I’m making more money without dropping my prices. Complements - Inverse P1 P2 QD1QD2 D1 D2 Boat Prices P QD QD Gasoline Demand No change in price They are so cheap that even dogs are buying boats
Substitutes – Direct [Increase in price of one;increasein “D”of the other] Price of iPod Video Demand for Microsoft’s Zune D2 D1 D P P2 P1 QD QD QD2QD1 1977, Bill was arrested for running a stop sign and driving without a license.
Diminishing Marginal Utility Each additional unit of an item purchased gives less marginal utility (happy points) than the previous unit. Therefore, the only way I will buy more is if the price is lower. Ex. When I’m hungry, I typically will buy2 breakfast tacos. The reason I don’t buy a third taco is because the marginal utility of the third taco is less than the price of the taco. But, if the price of the taco is less than the marginal utility of the taco, then I will buy the third taco D P1 P2 QD1 QD1
. I ate one hamburger, and it tasted great. The next two tasted okay. I wish I hadn’t have eaten the 5th. I can’t finish the 6th. Disutility [or negative utility]? DIMINISHING MARGINAL UTILITY Utility(satisfaction)decreases as more of the same product is consumed.
11.Elasticity of D – the way price affects QD.12.Elastic- QDthat isvery responsive to price.13.Inelastic- achg in price has littleimpact on QD. • Elastic (flexible) Demand • Substitutes (butter) • Luxury(mink coat) • Expensive(car) • Has durability(refrigerator) • Lasts a long time (gas-guzzling car) • Inelastic (inflexible) Demand • No substitutes(milk) • Necessity(insulin) • Inexpensive(safety pin) • No durability(pencil) • Lasts only a short time(bread)
. Elastic Demand For Cassette Tapes “TR” Test $2.50x100,000=$250,000 $1.50x600,000=$900,000 +$650,000 D -$1 Think of “responsiveness” as “flatness”.
“TR” Test $2 = $30 bil. $1 = $20 bil. -$10 bil. D -$1 +25% QD
1. Price change 2. Movement 3. Point to point [“Snap shot of 1 pt in time] 1. Non-price 2. Whole curve 3. Shift [“Time passes”] What could cause an “increase in Demand?” 5.Expectations of a shortage 1. Increase in taste 6. Expectations of a price increase 2 .Increase in income [normal good] 7. Expectations of positive future income 3. Decrease inincome [inferior good]8. Incr in price of a substitute for product “X” 4. Increase in market size[# of consumers] 9. Decr in price of acomplement of product “X” Change in QD [“Change in “PRICE”] Increase in “QD” [caused by a “decrease in price”] Decrease in “QD” [caused by an “increase in price”] D D P1 P2 P2 P1 QD1 QD2 QD2 QD1 Change in “D” [“TIMER”] D2 D1 D1 D2 P P “Decrease in D” “Increase in D”
+/-D/QD Graph The Black Boldfaced Items ___ ___ 1. A population increase affects sales of Blackberry phones. ___ ___ 2. Consumer incomes in the city of Plano decrease, with the result that jewelry sales are affected. ___ ___ 3. A camera store has a sale that features 25% off the price of all cameras. ___ ___ 4. Texas imposes a 15% luxury taxon the sale of sailboats. ___ ___ 5. A frost in Florida destroys 60% of the orange crop and increases expectationsabout a future price increase of oranges. ___ ___ 6. Consumers expect theprice of iPadsto decreasenext month. ___ ___ 7. The sale of DVDs is affected by a 20% increase in the price of DVD players. ___ ___ 8. The sale of bunsis affected by a 20% decrease in the price of complement - hamburger meat. ___ ___ 9. The sale of Kangaroo meat in Europe [Roo Steak] is affected by a 25% increase in the price of beef, which is a substitute for roo steak. ___ ___ 10. Dunkin Donutslowers the price of donuts& experiences a change in sales. + D - D QD + - QD D + - D - D D D1 P2 P1 [Complements - INVERSE] DVD Players QD2 QD1 DVDs + D D1 D [Complements - INVERSE] P1 P2 Hamburger meat Buns + D QD1 QD2 D D1 [Substitutes -DIRECT] P2 P1 Beef Kangaroo meat QD2 QD1 + QD
[D – “TIMER;QD – price change[inverse] __1.Which will cause an “Increase in Demand”for the Blackberry Curve? a. increase in income c. increase in the price of the Blackberry Curve b. decrease in income d. decrease in the price of the Blackberry Curve ___2. Which will cause an“Increase in QD”for the Blackberry Curve? a. decrease in income c. decrease in the price of the Blackberry Curve b. increase in income d. increase in the price of the Blackberry Curve ___3. Which will cause a“Decrease in Demand” for projectors? a. increase in the price of projectors c. decrease in # of consumers b. decrease in the price of projectors d. increase in projector taste ___4. Which will cause a“Decrease in QD”for projectors? a. increase in the price of projectors c. decrease in # of consumers b. decrease in the price of projectors d. increase in projector taste A C C A
NS 27-38 1. An increase in the price of Pepsi causes the demand curve for Coke to move to the (right/left). 2. If there is a sale on shirts, the demand curve for ties will move to the (right/left). 3. If a man’s workplace is about to close down, his demand curve for major purchases would move to the (right/left). 4. If a cure for lung cancer were found, the demand curve for cigarettes would move to the (right/left). 5. If the price of pancakes decreases, the demand for syrup, a complement, will (increase/decrease). 6. If the price of butter decreases, the demand formargarinewill (incr/decr). 7. A “change in QD” is caused by (price change/TIMER)[a “movement”] 8. A “change in D” is caused by (price change/TIMER) [a “shift”] e
Definitions Supply (S) the various amountssellers are willing and able to produce/sellat a series of possible prices at a given point in time Quantity Supplied (QS) the amountsellers are willing and able to produce/sellat a specific price at a given point in time.
Generally Speaking… Price __ Quantity Supplied Price __ Quantity Supplied direct ________ relationship?
Ben’s Supply Schedule- supply schedule is a table that shows the relationship between the price of the good and the quantity supplied.
1. An increase in price ... 2. ... increases quantity of cones supplied. Figure 5 Ben’s Supply Schedule and Supply Curve Price of Ice-Cream Cone $3.00 2.50 2.00 1.50 1.00 0.50 Quantity of 0 1 2 3 4 5 6 7 8 9 10 11 12 Ice-Cream Cones
$3.00 0 Change in Quantity Supplied Price of Ice-Cream Cone S C A rise in the price of ice cream cones results in a movement along the supply curve. A 1.00 Quantity of Ice-Cream Cones 0 1 5
Change in QS [“Change in “price”] Decrease in “QS” [caused by a “decrease in price”] Increase in “QS” [caused by an “increase in price”] S S P2 1. Price change 2. Movement 3. Point to point [“Snap shot of 1 pt in time] P1 P2 P1 QS1 QS2 QS1 QS2 Change in “S” [RATNEST] S2 S1 S1 S2 1. Non-price 2. Whole curve 3. Shift [“Time passes”] P P “Decrease in S” “Increase in S” What could cause an “increase in supply?” 4. Increase in number of producers 1. Decrease in resource cost [wages/raw materials] 5. Producer expectations of $ decrease 2. Decrease in the price of analternative outputfor “X”6. Increase in subsidies 3. Increase in technology 7. Decrease in taxes
ResourceCost [wages & raw materials] [inverse] 58. Increase in wages (increases/decreases) supply. Ex: A decrease in the price of computer chips (increases/decreases) the supply of computers. Resource Cost Example S3 S2 S1 P
I only have 200 acres 2. Alternative Output Price Change [Inverse] These are “things that can be supplied with the same resources”. Corn S1 Broccoli S2 P1 S P2 P QS1 QS2 Producers want to produce more of the good where price is increasing, Corn Broccoli S1 S P1 S2 P P2 QS1 QS2 or at least, where the price is not going down. “Substitutes in production” [Remember, productive resources are scarce]
“Can’t wait till milking time.” 3. Technological Improvement This lowers production costs & increases “S”. Ex: Suppose a new milking machine called “The Invisible Hand” has a very soothing effect on cows; cows find the new machine so “udderly” delightful that they produce 30% more milk. This technological advance will cause a shift to the right. 54
56.If more firms enter an industry, the supply curve will shift to the (left/right). When the American Basketball League began play in 1968, there was a (bigger/smaller) supply of basketball games each week. 60. A new professional football league will (increase/decrease)the supply of football games. 4. Number of Producers [Direct] S3S1 S2 P
59. If oil producers expectfuture oilprices todecline, they will (increase/decrease) current production. P 5. Producer Expectations about Future Price [“INVERSE”] S2 S1 S2 Oil Prices expected to decrease Oil Prices expected to increase If oil producers expect future oil prices to increase, they will (increase/decrease) current production. For example, if the cattle farmerexpects higher prices for beef in the future, he will send (more/less) cattle to market now. He will keep them on the farm now and would send the cattle to the market in the future when prices are expected to be higher.
6. Subsidies – free money from government [Direct] S3 S1 S2 P Free money from the government (subsidies) induces suppliers to supply more. If subsidies are taken away, then suppliers are losing money and will decrease supply.
7. Taxes Take Away Business Profits & Decrease Supply. [Inverse] S3 S1 S2 P I’m losing profits.” If business have their taxes decreased, it moves the supply curve to the right. 55. If business have their taxes increased, it moves the supply curve to the (left/right).
45.Elastic Supply – a small increase/decreasein price causes significant change in QS. Elastic supply is very responsive to price changes. • Elastic (Flexible) SupplyInelastic (Inflexible) Supply • Can be made quickly 1. Cannot be made quickly • Little expense (few 2. Great Expense (large capital • capital resources required) resources required) • 3. (47)Unskilledworkers 3. (48)Skilled workers • 4. Long time 4. Short time • 5. Don’t need scarce 5. Scarcity of natural resources • natural resources • Examples: (50) T-shirts, hats, Examples: Gold, diamonds, • shot glasses, and posters and (49) computers
46. InelasticSupply - regardless of price, producers are unwilling/unable to increase/decreaseQS. (QS is inflexible and unresponsive to price changes) 51.Elastic supply results in a morehorizontalline &52.inelastic supply results in a moreverticalline. Elastic supply is very responsiveto price&inelasticsupply isunresponsiveto price. 0 1000 2000 3000 4000 5000
6. Show what happens to the Demand for Apples if they are found to fight cancer. 7. Show what happens to the Demand for Gasoline if a Hurricane is heading toward us. 8. Show what happens to the Production of a Chemical Plant if the Govt cuts restriction on pollution. 9. Show what happens to the Demand for Coach Days tutoring as the Test Approaches. 10. Show what happens to the Supply of Labor in a Job that has Great Benefits
11.Show what happens to the Demand for Labor If the Govt raises the Minimum Wage. 12. Show what happens to the supply of Labor if the Govt raises the Minimum Wage. 13. Show what happens to the Demand for Cars if the govt lowers the Legal driving Age. 14. Show what happens to the Demand for Beer if the govt raises the legal drinking age. 15. Show what happens to the demand of diapers if there is an influx of new immigrants.
16. Show what happens to the demand for Flashlights if a hurricane is expected. 17. Graph the demand for Coke and Pepsi if coke goes on Sale. 18. Graph the supply of Coke and Pepsi if they both raise their prices. 19. Graph the Demand for Coke and Pepsi if they both lower their prices. 20 What is the Law of demand.
SUPPLY AND DEMAND TOGETHER • Equilibrium Price • The price that balances quantity supplied and quantity demanded. • On a graph, it is the price at which the supply and demand curves intersect. • Equilibrium Quantity • The quantity supplied and the quantity demanded at the equilibrium price. • On a graph it is the quantity at which the supply and demand curves intersect.
SUPPLY AND DEMAND TOGETHER Demand Schedule Supply Schedule At $2.00, the quantity demanded is equal to the quantity supplied!
Gasoline- Hurricane Wipes out some of the Gasoline Refineries p s Ep 1.00 d eq q 100
Gasoline- Hurricane Wipes out some of the Gasoline Refineries s2 p s s ep2 Ep 1.00 d eq q eq2 100
Gas-China has a billion People and they are all starting to get cars p s Ep 1.00 d eq q 100
Gas-China has a billion People and they are all starting to get cars p s D Ep 1.00 d2 d1 eq q 100
D Astros T shirts if they are in the world series p s Ep 20 d2 d1 eq q 100