Download
1 / 43
430 likes | 567 Views
Daily Mean Temperature- Effectiveness of different observational schemes. Colin Sowder , Lee Richardson, Alex Januzi , Dan Jones. General Outline. Our objective was to assess the variance and bias corresponding to different observational schemes for estimating mean temperature

E N D
Daily Mean Temperature- Effectiveness of different observational schemes Colin Sowder, Lee Richardson, Alex Januzi, Dan Jones
General Outline • Our objective was to assess the variance and bias corresponding to different observational schemes for estimating mean temperature • Our goal in looking at different observational schemes is to find the most practical way of getting an accurate estimate for the daily mean. • This gets more complicated the more you look into it, as different locations and seasons follow different patterns. • Because of this, we looked at observational schemes that could be applied homogeneously to all stations
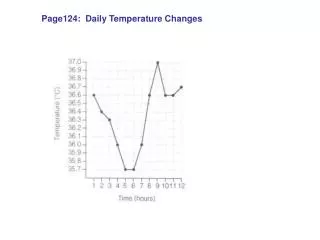
Daily Temperature Variations - DiurnalVariation of Solar and Terrestrial Radiation • the diurnal variation of incoming solar radiation – it begins at sunrise – it's a max at noon – it shuts off at sunset • the diurnal variation of earth-emitted terrestrial radiation – its trend is similar to the – diurnal temperature trend: – minimum at sunrise – maximum at 3-5 PM http://www-das.uwyo.edu/~zwang/atsc2000/Ch3.pdf
Daily Temperature Variations - Net Radiation • The net radiation determines whether the surface temperature rises, falls, or remains the same: • net radiation = incoming solar - outgoing IR • If the net radiation > 0, surface warms (6 AM - 3-5 PM) – If the net radiation < 0, surface cools (3-5 PM - 6 AM) • This explains why the warmest part of the year is in July/August, not on 21 June during the summer solstice. http://www-das.uwyo.edu/~zwang/atsc2000/Ch3.pdf
The daily range of temperature decreases as we climb away from the earth’s surface. There is less day-to-night variation in air temperature at higher altitudes compared to ground level. Typical temperature reading stations are 2-3m off the ground. In summer, solar radiation is more direct with higher net radiation levels. This could require more frequent readings. In winter, solar radiation is more spread out. This could require less frequent readings. http://www-das.uwyo.edu/~zwang/atsc2000/Ch3.pdf
In mid-latitudes, solar radiation exhibits a pronounced annual maximum and minimum and the seasonal difference in solar radiation is extreme in polar latitudes. As a result, distinct winter-to-summer temperature contrasts are observed in middle and high latitudes. • Our observed data (Visby and Iowa) falls within the 40 – 60 degree mid to high latitude range, providing for similar effects of the spread of radiation with seasonal variations. http://scijinks.nasa.gov/weather-v-climate
Therefore, you could expect that in the summertime with greater concentrations of solar radiation (more net radiation, possibly greater lag times), the temperatures would be more dynamic. • Likewise in the winter, with solar radiation more spread out, + and – net radiation levels would be smaller, reducing the variability and need to record temperature readings as often.
Source: TimeandDate.com This is true in our Data as well, as the blue line (July Visby Data) is more variable than the red line (January Visby Data). The Rise and fall of the hourly mean temperature’s also correspond with the average sunrise/sunset in each month.
Research Question The questions we looked at were the effectiveness of the daily min and max temperature as well as the effect of bias and variability of different observational schemes. We considered various hourly schemes with different number of observations as well as different starting times. The value that we were trying to predict was the mean temperature of minute observations each day. To answer these questions, we are using minute data from Visby, Sweden as well as Red Oak, Iowa, because minute data is the finest resolution possible.
Commonly used methods of calculating daily mean temperature in the literature: • Mean of the 24 hourly means • Mean of the maximum & minimum temperatures • Weighted mean: 3 observations, last observation weighted twice • Mean of equally spaced observations (e.g. every 3 hours) Source: Weiss, A., & Hays, C. J. (2005). Calculating daily mean air temperatures by different methods: implications from a non-linear algorithm. Agricultural and forest meteorology, 128(1), 57-65.
Criteria for a good metric • The Criteria we looked at for a good observational scheme were bias and variance. The goal was a for both to be as small as possible • To combine these two criteria, we used Mean Squared Error, where: MSE = Var + (Bias)^2
Observational Schemes that we looked at • We looked at estimates which recorded observations every hour, 2 hours, 3 hours (anything divisible by 24), etc. • In each observational scheme, with the exception of the hourly, we were able to “tune” our observations to start at different hours. • Each observational scheme we looked at was evaluated with the MSE in mind • The MSE values in hour observational schemes were looked at in comparison to the Daily min/max average that is used in many countries.
Idea Behind Tuning Hourly Observations • When taking hourly estimates, we explored starting our estimates at different times, rather than at the default 0 mark. • The less observations for certain hourly schemes, the more options for tuning there were, ex: you could start 3 hourly observations at the 0, 1, or 2 hour
A return to Visby – One more thing • Recall the MSE for daily range in July was 0.531 • The original calculations for Visby produced the following table: • What happened?
Visby – July 7th In addition to missing data, there was an outlier of 2.6 C
Visby – July Corrected • Eliminating the outlier gives the previous results: • Results change dramatically for Range-based metric. • Maxes and Mins may be more likely to be in error.
Conclusions • More observations per day are better! • The mean of max and min may not be the best measure of daily mean temperature. • Two evenly spaced daily observations outperformed by MSE for two of the three study sites (Red Oak) • Susceptible to errors in measurement • “Tuning” improves Mean Square Error • May need to be site specific • Winter temperatures have lower Mean Square Error than Summer temperatures at the same site • Fewer observations needed per day to have the same MSE
Further Questions • What is the best balance of MSE to number of observations per day? • What can practically be stored? • Can we use our knowledge of temperature to create even better metrics? • For example: Tie observation times to the Sun • Can the tuning parameter be set using this knowledge? • How robust are the various metrics to missing data? • What effect does measurement error have on these metrics?