Download
1 / 13
130 likes | 247 Views
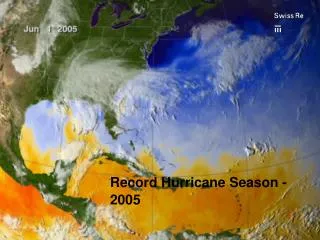
Extending the North Atlantic Hurricane Record Using Seismic Noise. Carl Ebeling (carl@earth.northwestern.edu) and Seth Stein. Department of Earth and Planetary Sciences Northwestern University American Geophysical Union Fall Meeting December 15, 2009 S22B-04. Energetic ongoing debate:

E N D
Extending the North Atlantic Hurricane Record Using Seismic Noise Carl Ebeling (carl@earth.northwestern.edu) and Seth Stein Department of Earth and Planetary Sciences Northwestern University American Geophysical Union Fall Meeting December 15, 2009 S22B-04
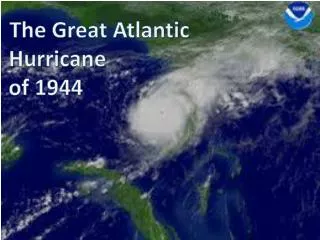
Energetic ongoing debate: Are rising sea-surface temperatures in the North Atlantic resulting in trends in hurricane frequency and energy? Or, alternatively: 2005 1933 (Figure after P. Klotzbach; map source NOAA)
It’s difficult to answer with the existing hurricane record • Length: It’s short • Completeness: Undercount in historical record is likely Seismology can help: • Develop discriminant using digital seismic data recorded during times of well-characterized hurricanes • Apply to decades-long archive of ambient seismic noise records (Image source: NOAA)
The Earth’s Noise Spectrum: An Example Seasonal variability in frequency and amplitude of primary and secondary peaks—related to storm energy Secondary microseismic peak Generated by interference between groups of waves of same frequency traveling in opposite directions. Energy coupled to sea floor; pressure variation does not decay with depth (Longuet-Higgins, 1950). Primary microseismic peak Generated by pressure variations due to vertical fluctuations of waves over shallowing seafloor (Hasselman, 1963) and through interaction with coastlines. 2005 monthly mean power spectral densities for SANAE station (Antarctica)
Atmosphere (Wind)-Ocean Wave Link Wind speed and wave frequency are linked Spectra of ocean waves for different wind speeds (after Moskowitz, 1964) From seismology: Higher energy is indication of increased storm energy (Astiz and Creager, 1994) Frequency of largest wave is indication of maximum sustained wind speed (Bromirski et al. 1999) Depression: < 18 m/s Tropical Storm: 18-32 m/s Hurricane: > 33 m/s Major hurricane: > 50 m/s Primary microseismic peak frequency Secondary microseismic peak frequency
Tropical Depression Tropical Storm Hurricane Hurricane Andrew • August 23-26, 1992 (cat. 4 at landfall) • 922 mb at landfall • Sustained winds of 227 km/h • Gusts to 282 km/h • 40 dead; US$ 20 billion in losses (Image source: NOAA) HRV • HRV (Harvard, Mass.) seismic station: • Streckeisen STS-1, 1 Hz sampling • Long-lived seismic station relatively near path of N. Atlantic hurricanes
Andrew: Preliminary Results Power in signal is proportional to amplitude squared Concerned about relative changes only (pseudo-power) But non-hurricane signals in raw pseudo-power signal (only hurricane Andrew in August)! Andrew? Q3 1992 raw pseudo-power recorded at HRV Take advantage of shift of secondary microseism peak to longer periods with greater storm energy and filter appropriately
Andrew: Preliminary Results (Pseudo-power and maximum wind speed) Pseudo-power (raw) Pseudo-power (bp filtered, 5-7 s)
Andrew: Preliminary Results Energy shifts to longer periods with increasing intensity
Tropical Depression Tropical Storm Hurricane Andrew: Preliminary Results Andrew can be “seen” in HRV seismic data Solid circle:Meteorological characterization of hurricane, scaled by 5-7 s mean spectral amplitude Open circle: Empirical seismological hurricane discriminant applied: No hurricane = green Hurricane = red Discriminant Pseudo-power, 6-hr mean with seismically-identified hurricane (red circles)
Conclusions Hurricane Andrew can be identified seismically while offshore by using microseismic power recorded at a distant seismic station. Microseismic power must be filtered to recover this signal (5-7 s passband in the case of hurricane Andrew).
Future Work • Discriminate local storms by using data from additional station (San Juan, Puerto Rico [SJG]) • Evaluate effect of water depth, tectonic boundaries • Extend analysis to number of storms with varying intensities • Convert large numbers of analogue seismograms to digital records on production basis
Acknowledgements • Incorporated Institutions for Seismology (IRIS) Data Management Center (DMC) • Global Seismic Network (GSN)-IRIS/USGS • Dr. Luciana Astiz, University of California, San Diego • Dr. Phil Klotzbach, Colorado State University • National Science Foundation Graduate Research Fellowship Program