Download

1 / 9
90 likes | 201 Views
Agenda Assignment: Page198 (1 - 4 all) (5 - 19 odds) Page 205 (1 - 4 all) (5 - 8 all) (30 - 35 ) D ue: Page 190 (2 – 22 evens) (54, 55, 56 ) ** Survey Results. Bellwork Read the following pages: 193 – 198 and 201 – 204 Things to think about: Where have I used or seen these graphs?

E N D
AgendaAssignment: Page198 (1 - 4 all) (5 - 19 odds) Page 205 (1 - 4 all) (5 - 8 all) (30 - 35)Due:Page 190 (2 – 22 evens) (54, 55, 56)** Survey Results Bellwork Read the following pages: 193 – 198 and 201 – 204 Things to think about: Where have I used or seen these graphs? Why are graphs useful? Which graphs would be useful with my survey results?
Labeling Graphs • Graphs ALWAYS need the following: • Title, X axis labeled, Y axis labeled, sections labeled, LABEL LABELLABEL!!!!!! • The more information the better!!!! • Graphs are used to analyze data at a glance. • Easy way to read information. • Different sets of data requires different types of graphs.
Bar Graph • Uses rectangular bars or objects to represent data. • Used to compare individual or distinct data.
Line Graph • Uses line segments between data points to show changes that occur over time. • Can be used to show trends, increases, decreases.
Circle Graph • Data is used at “part” of a circle or “percents of a whole” • Used with businesses, budgets, schools, ect.
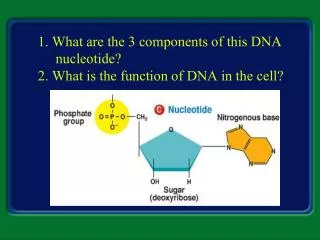
Stem-and-Leaf Plots • Organizes LOTS of data or #s into “stems” and “leafs” • Stems – represent the first part or “digits” of each number • Leaf – represents the last digit of each number.
Histograms • Is a bar graph with no spaces between bars. • Measures frequency (how often an event occurs). • Uses data from a stem-and-leaf plot.
Box-and-Whisker Plots • Data is distributed into five parts: • Median – middle value of data • Lower Quartile – median value of lower data • Upper Quartile – median value of upper data • Minimum– smallest value in data • Maximum – largest value in data
Vmath and Group Time • In the classroom add these problems to your notes: • Complete the following: • Page 198 (6 – 18 evens) (20 – 23) • Page 206 (37, 38, 39) • On the computers: Log on to www.vmathlive.com • Complete the following under Data, Probability, Stats • Box and Whisker • Line Plots • Histogram • Stem and Leaf • Circle Graphs