Download
1 / 11
110 likes | 370 Views
Home. Beth 2/21. The X-axis needs to be consistent between the different graphs There should be a label under each bar (or set of bars in the same time period). Beth 2/21. Energy Use By Type + Year to Year Energy Utilization. “Show By” should be separated into 2 filters month vs. year

E N D
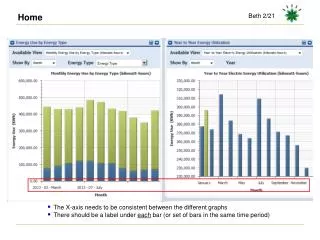
Home Beth 2/21 The X-axis needs to be consistent between the different graphs There should be a label under each bar (or set of bars in the same time period)
Beth 2/21 Energy Use By Type + Year to Year Energy Utilization • “Show By” should be separated into 2 filters • month vs. year • World vs. Geo vs. Location • Got an error when I tried to change the Show By filter in Energy Use By Type: • Was asked to log in when I tried to change the Show By filter in Year-to-Year Energy Utilization, then was told I already was logged in. • Then it took me to a graph by Location, but I couldn’t get back to Home. • Got an error when I clicked on Apply Filters • Tried a few other clicks; never could figure out how to get back to Home.
Beth 2/21 Asset Event Work Tasks • Not quite following what this graph is supposed to be telling me. • Is this the # of alerts in the month? • Or the overall # of WO’s for the month, whether Smarter Bldgs rules related or not? • Or something else completely? • Will there be filters for this graphic, too? • Month vs. year • World vs. Geo vs. Location • Why does it only show one month? Is it meant to show only the open events?
Beth 3/7 Reminders • Are Requests = current “service requests”? • What are Surveys? • What are Checklists? • What is the difference between Pending & In-Progress? • Pending = new? • In-Progress = you’ve started working on them?
Beth 3/7 In Progress Opportunities Who creates the list of opportunities? Who determines the payback & ROI? The energy savings? Etc.
Beth 3/7 Sustainability Why Repeat Asset Event Requests & Repeat Asset Event Work Tasks included in this Sustainability section? Why only Repeat and not all? Will these dashboards work if we do not have the energy data (i.e., just show the Requests & Work Tasks)?
Beth 3/7 Repeat Asset Event Requests The calendar function does not work. When I click on a day, it gets highlighted but then the calendar does not close and the date does not populate the cell. (I typed in 2/18.) Same is true for Repeat Asset Event Work Tasks
Beth 2/21 Requests • What are Requests? Are they the same as a Maximo Service Request? • Is this part meant for non-Maximo users? • If so, how might it conflict with Maximo? • What are Survey Requests? • What is the difference between Requests and Tasks? • What is the difference between Requests and Events?
Beth 3/7 Repeat Asset Event Requests Are events the same as ITEO alerts? Why are they in Sustainability > Set Up > Analytics? Each item appears to be a hyperlink, but nothing happens if I click on it. How do I get to the data behind the event (the Event Test Tool equivalent)? What is the cell “contains” for? Is it to set up what filters you want for this view.
Beth 3/7 Help Clicked on Help hoping to find answers to questions on previous page, but there’s nothing there (yet). Clicking on the search icon did not bring up a search box.
Beth 3/tbd TBD TBD