Download
1 / 53
550 likes | 801 Views
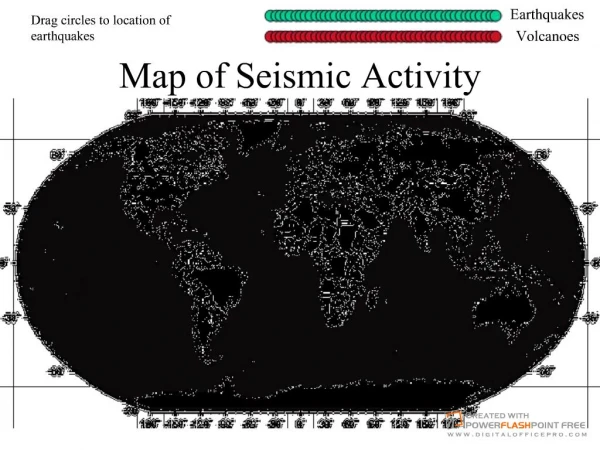
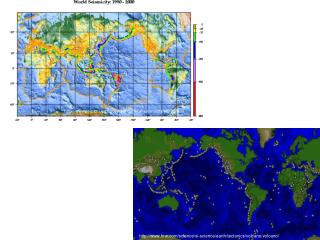
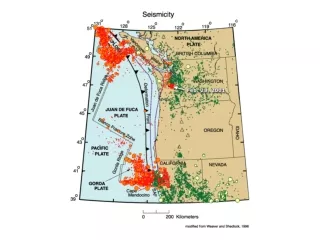
Global seismicity. Earthquake epicenters (locations) are shown by the colored dots. Note locations and concentrations of activity. Compare with volcano locations. Plate collisions and volcanoes. Ocean-ocean Ocean-continent Continent-continent. India-Asia continent-continent collision.

E N D
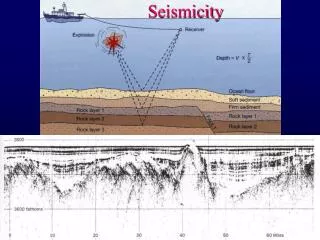
Global seismicity Earthquake epicenters (locations) are shown by the colored dots. Note locations and concentrations of activity. Compare with volcano locations.
Plate collisions and volcanoes Ocean-ocean Ocean-continent Continent-continent
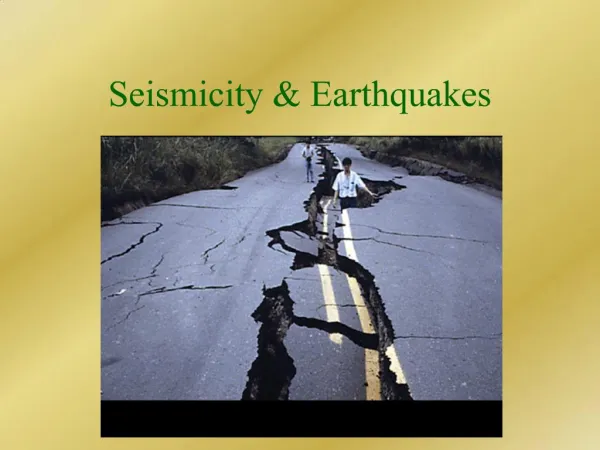
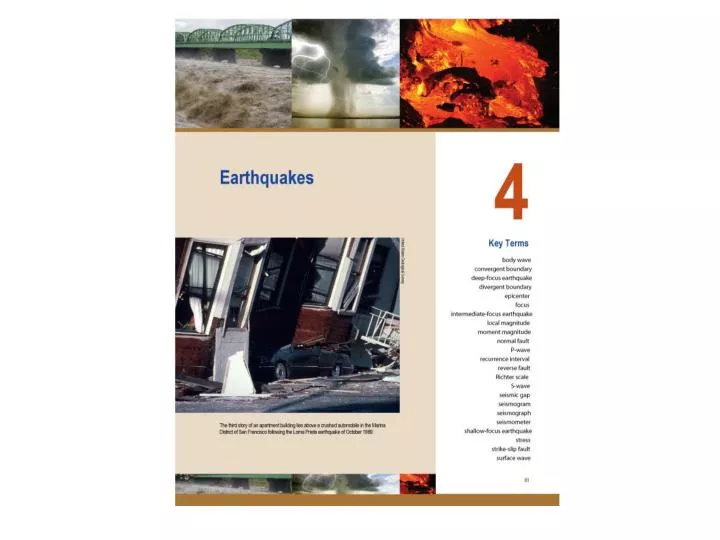
Rock Behavior • How rocks respond to applied forces (stress) • Stress – force per unit area (lbs per sq in) • Response is termed “strain” • Elastic deformation (reversible) • Ductile deformation (flow) • Brittle deformation (fracture)
Rock breakage • Fracture • Separation only; no vertical movement • Fault • Vertical and/or horizontal motion
Footwall block Hanging wall block
Note different fault motions Normal or dip-slip fault Strike-slip fault Reverse fault
Subduction process Shallow-focus: 0 to 70 km depth Intermediate-focus: 70 to 300 km depth Deep-focus: 300 to about 700 km depth
Earthquake magnitudes • Measures the “size” of an EQ • Four types of measurements • Local (ML) – original Richter scale • Body-wave (Mb) – P-wave amplitude • Surface-wave (Ms) – Rayleigh-wave amplitude • Moment (Mw) – considers amount of strain energy release along entire fault rupture.
The Big Ones Japan Mar 2011 9.0
Intensity scale • Measures damage caused by seismic energy • Established by Mercalli (Italian) in 1902; modified in 1931 to reflect enhanced building standards in US • Uses Roman numerals (I – XII) • Values depend on EQ magnitude, distance from source, bedrock type, building material and style, duration of shaking
Earthquakes don’t kill people- buildings do • Many deaths in older regions on Earth due to poor quality construction, especially through trans-Mediterranean/Asiatic belt • Secondary events (aftershocks) destroy already weakened structures • Surface waves produce the greatest damage
Benefits of EQs • Changing natural resource paths • Groundwater • Oil and natural gas • Exposures of minerals • Natural mitigation • Small events lessen likelihood of large events
Short-term predictions • Precursors • Events that imply an EQ; usually small magnitude events, often in swarms • Foreshock (sometimes) – main shock – aftershock • Ground deformation • Water level changes in wells • Seismic gaps • Greatest potential for large events in the gap
Effects of EQs • Shaking and ground rupture • Liquefaction • Regional elevation changes • Landslides • Fires • Disease
Humans cause earthquakes by • Crustal loading by dams and reservoirs • Injection of liquid waste • Underground nuclear explosions
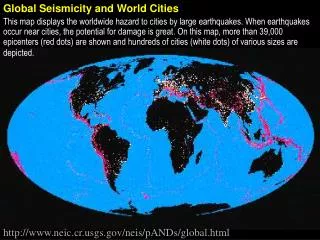
Earthquakes in the United States Where do most EQs occur in US and why? What’s happening in eastern & central US
Subduction zones in western North America • Alaska • Subduction of Pacific Plate • Pacific Northwest (BC-WA-OR-CA) • Subduction of Juan de Fuca Plate and smaller Gorda Plate • Cascadia Subduction Zone • Volcanoes on land
Subduction Zone Earthquakes • Largest EQs worldwide • 9 of the 10 largest earthquakes (1904-2008) were related to plate subduction • One in Tibet was due to India hitting Asia • These 9 occurred along Circum-Pacific “Ring of Fire” • Five EQs were located in northern Pacific [Japan-Kamchatka-Aleutians]
Examples of Subduction Zone Earthquakes • Chile 1960 (Mw = 9.5): Nazca Plate diving under South American Plate; tsunami producer • Alaska 1964 (Mw = 9.2): Pacific Plate dives beneath North American Plate; tsunami producer • Mexico 1985 (Ms = 8.1): Cocos Plate dives beneath North American Plate • Indonesia 2004 (Mw = 9.1): India Plate dives under Burma Plate; major tsunami producer • Japan 2011 (Mw = 9.0): Pacific Plate dives under North American Plate; major tsunami producer
Seismic Gap, Mexico, Sept 19,1985 Ms = 8.1 • Mexico earthquake filled Michoacan seismic gap • Guerrero gap remains • Major aftershocks of Ms =7.5 and 7.3 within a month
Average annual worldwide frequency of EQs magnitude 6.0 or greater • M 6.0 – 6.9 Strong 100 • M 7.0 – 7.9 Major 15-20 • M 8.0+ Great 1 every 2-3 years
San Andreas Fault System • Movement occurs on many faults • Displacement is distributed over a wide zone • Right-lateral strike-slip motion
San Andreas: Earthquake Probabilities • Probability of major earthquake (1988-2018) • Use historical and sag-pond data to calculate recurrence intervals
Loma Prieta, Oct 17,1989 [World Series EQ] • Magnitude 6.9; 67 killed • Epicenter at Loma Prieta, highest peak in Santa Cruz Mountains • 100 km SSE of San Francisco • Section of San Andreas that moved in 1906 EQ ruptured again • Marina district in SFO was built on rubble from 1906 EQ; mud was pumped in to fill holes; very unstable “land” • Game 3 halted by Commissioner; after 10-day recess, series continued in Oakland – Oakland swept series 4 games to 0.
Plate boundary is not a discrete line, but rather a zone the width of the Bay Area Notice the many major faults that are parallel to the San Andreas fault
Univ of California stadiumin Berkeley • The trace of the Hayward fault runs through goal posts • Left side is moving N [top of image]
30 yrs of activity; crosses are epicenters