Download
1 / 1
10 likes | 189 Views
Using inundation deposits to constrain the storm surge heights of storms that affected New York City, NY: H ow does Hurricane Sandy compare?. SG4. SG3. SG2. WP3. SG1. WP2. Christine M. Brandon, University of Massachusetts Amherst Email: cbrandon@geo.umass.edu

E N D
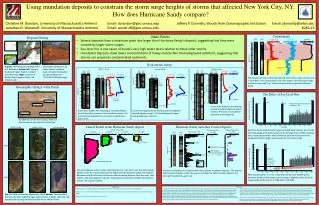
Using inundation deposits to constrain the storm surge heights of storms that affected New York City, NY: How does Hurricane Sandy compare? SG4 SG3 SG2 WP3 SG1 WP2 Christine M. Brandon, University of Massachusetts Amherst Email: cbrandon@geo.umass.edu Jonathan D. Woodruff, University of Massachusetts Amherst Email: woodruff@geo.umass.edu Jeffery P. Donnelly, Woods Hole Oceanographic Institution Email: jdonnelly@whoi.edu #246-15 Inlet opened by Irene WP1 Overwash fan 50 m 50 m Main Points Contaminants > 63 μm 1920 1960 2000 1800 1820 1840 1860 1880 1900 1940 1980 Regional Setting > 30 μm • Several deposits have a maximum grain size larger than Hurricane Sandy’s deposit, suggesting that they were created by larger storm surges. • Sea-level rise is one cause of Sandy’s very high water levels relative to these older storms. • Inundation deposits show lower concentrations of heavy metals than the background sediment, suggesting that storms can sequester contaminated sediments. WP2 Photo WP2 X-ray Zn (XRF int.) Pb (XRF int.) Hg (ppb) NY CT New Jersey Battery Low Atlantic Ocean Hur. Sandy Deposit 0 1000 2000 0 200 400 600 0 200 400 600 NJ Brooklyn 100 km Staten Island High Harbor Hill Terminal Moraine Seguine Pond Depth (cm) ? Arbutus Lake Wolfe’s Pond 10 km Radiometric dating The Harbor Hill moraine on Staten Island’s southern coast, deposited during the Last Glacial Maximum (~20,500-18,000 years ago). Top left: The field area is located in the U.S. Northeast. Bottom left: Sites are located on Staten Island’s southern coast (red box). Right: Location of Wolfe’s Pond, Seguine Pond, and Arbutus Lake. Background Wolfe’s Pond Seguine Pond Arbutus Lake Zn (XRF int.) AL4 Photo AL4 X-ray AL3 Photo AL3 X-ray WP2 Photo WP2 X-ray SG2 Photo SG2 X-ray 137Cs (Bq/g) 0 2000 0 137Cs (Bq/g) Zn (XRF int.) Zn (XRF int.) 137Cs (Bq/g) 0 2000 WP2 Photo WP2 X-ray SG2 Photo SG2 X-ray Hur. Sandy Deposit 0 1000 2000 0 0 0 The presence of three industrially derived metals (zinc, lead, and mercury) in Core WP2. The concentrations are much lower in the Hurricane Sandy inundation layer and “cap” more contaminated fine-grained sediments below. 0 0.02 50 50 50 Depth (cm) 100 Hur. Sandy Deposit Hur. Sandy Deposit 0 0 0 100 100 100 150 Geomorphic Change of the Ponds 150 1963 AD 10 10 10 200 200 Depth (cm) 1859 200 Depth (cm) Core gap Core gap 1963 AD The Effect of Sea Level Rise Depth (cm) Depth (cm) 20 20 20 250 1954 AD 300 1850 AD Depth (cm) 300 Erosional horizons? 1954 AD 30 30 30 4 Seguine Pond 350 400 2012 Maximum Yearly Water Levels at the Battery , NYC 3.5 0 0.04 0.08 Arbutus Lake 400 40 40 40 1821 1821 storm A core from Arbutus Lake showing several inundation deposits (green arrows). The black arrows denote particularly thick deposits. 1788 1893 3 450 500 A core from Wolfe’s Pond showing a truncated historic record, possibly by erosion from inundation events. The Hurricane Sandy deposit has a red color, indicative of glacial fines. A core from Seguine Pond showing several inundation deposits (green arrows). The Sandy deposit is again distinguished by a red color. 50 50 50 2.5 0 0.02 0.04 Wolfe’s Pond 1 km Elevation relative to MSL (m) 2 600 1.5 An 1859 map of the three ponds. Note that all of the ponds had inlets to Raritan Bay. 1 0.5 Lateral Trends in the Hurricane Sandy deposit Hurricane Sandy and other Coarse Deposits Wolfe’s Pond Seguine Pond Arbutus Lake 0 Hurricane Sandy produced the largest recorded water level by far (records from tide gauge at the Battery, New York City beginning in 1920). However, three reconstructed water levels show that past hurricanes may have produced similar or larger water levels than Hurricane Sandy. Median Grain Size D50 (μm) Maximum Grain Size D90 (μm) Percent Coarse (%) SG2 Photo SG2 X-ray Year (AD) 63 200 0 25 50 75 100 Percent Coarse (%) 0 100 200 300 400 500 Sandy Sandy Sandy Core SG1 Core SG2 Core SG3 Core SG4 0 25 50 75 100 0 25 50 75 100 0 25 50 75 100 0 25 50 75 100 0 AL6 0 1960? 4 AL4 2010 2012 5 1954 AD Cs-137 Onset AL2 > 38 μm > 63 μm 3.5 50 1821 Depth (cm) 1850-1900 AD Heavy Metal Horizon 1788 1893 3 1893? 10 Depth (cm) 1821? 1821? 2.5 100 50 m 2 15 1788? Elevation relative to MSL (m) Long-Term Sea-Level Trend at Battery (2.7 mm/y) NOAA, 2013 1.5 150 20 1 Median (D50) grain size The percentage of coarse, clastic material (grain size > 63 µm) in the Hurricane Sandy deposit in the four cores collected from Seguine Pond (November 2012). The deposit decreases in both thickness and %coarse with increasing distance from the coast. Also shown is the percentage of material > 38 µm (gray areas) which exhibits the opposite trend as the coarse material. 0.5 Hurricane Sandy deposit compared with other historic inundation deposits. This deposit had the second largest median (D50) grain size after the 1821 hurricane deposit, but among the smallest D90 grain size. 200 0 After accounting for ~2.7 mm of sea level rise per year (NOAA, 2013) Hurricane Sandy’s storm surge is just as large or slightly smaller than the surges produced by storms in 1788, 1821, and 1893. -0.5 2012 1800 1820 1840 1860 1880 1900 1920 1940 1960 1980 2000 References NOAA Tides and Currents (2013), available from http://tidesandcurrents.noaa.gov/sltrends/sltrends_station.shtml?stnid=8518750 Scileppi, E. and J. P. Donnelly (2007), Sedimentary evidence of hurricane strikes in western Long Island, New York, Geochemistry Geophysics Geosystems, 8, Q06011. Walling, H.F. (1859), Staten Island, Richmond County, New York Abstract The importance of extreme events in shaping ecosystems and governing sediment transport is in part determined by how often these events occur. By their very nature these events are rare, making it difficult to accurately assess their return frequency. On October 29, 2012 Hurricane Sandy inundated New York City, NY, raising water levels to 3.5 m above mean sea level at the Battery (located at the south end of lower Manhattan). Historical records indicate that this is the highest measured water level since records began at this location in the mid-1700s and simulated hurricane climatology ranks this storm as a 1-in-1000 year event. However, tide gauge data alone is generally too short to either obtain meaningful extreme value statistics, or evaluate the skill of flood probabilities derived solely from numerical simulations. Thus there is a real need for longer flood reconstructions of the New York City region. Further, questions remain with respect to whether extreme events like Sandy serve to mobilize contaminants (e.g. lead, mercury) within the harbor or cover these sediments with more pristine glacial material eroded from the surrounding landscape. Sediment cores were taken from Seguine and Wolfe’s Ponds (back-barrier ponds) located on Staten Island’s southern coast, about one month after Hurricane Sandy impacted the area. Additional cores were taken from Arbutus Lake in September 2013. The cores contain several coarse grained deposits most likely associated with storm surge inundation of the ponds, including a surficial deposit associated with Hurricane Sandy’s surge. Age constraints on the inundation deposits are developed by using the Cs-137 radiometric dating method and the onset of industrially derived heavy metals. The grain size distribution is measured for the event deposits to help constrain flow conditions required for erosion and transport of sediment. We find that 1) several deposits have a maximum grain size larger than Hurricane Sandy’s deposit, suggesting that they were created by larger storm surges, 2) sea-level rise is one cause of Sandy’s very high water levels relative to these older storms, and 3) inundation deposits show lower concentrations of heavy metals than the background sediment, suggesting that storms can sequester contaminated sediments. Top: The field sites as they appeared in 2010. Bottom: The sites after Hurricane Sandy’s landfall (images taken on Nov. 3, 2012). Note the new overwash fans at Seguine Pond and the inlet in Wolfe’s Pond.