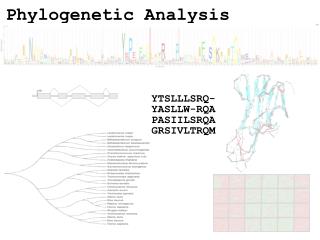
Intro. To Phylogenetic Analysis
Intro. To Phylogenetic Analysis. Slides modified by David Ardell From Caro-Beth Stewart, Paul Higgs, Joe Felsenstein and Mikael Thollesson. What is phylogenetic analysis and why should we perform it? Phylogenetic analysis has two major components:

Intro. To Phylogenetic Analysis
E N D
Presentation Transcript
Intro. To Phylogenetic Analysis Slides modified by David Ardell From Caro-Beth Stewart, Paul Higgs, Joe Felsenstein and Mikael Thollesson
What is phylogenetic analysis and why should we perform it? Phylogenetic analysis has two major components: 1.Phylogeny inference or “tree building” — evolutionary relationships between genes or species 2. Character and rate analysis — mapping information onto trees C-B Stewart, NHGRI lecture, 12/5/00
Common Phylogenetic Tree Terminology Terminal Nodes Branches or Lineages A Represent the TAXA (genes, populations, species, etc.) used to infer the phylogeny B C D Ancestral Node or ROOT of the Tree CLADE E Internal Nodes (represent hypothetical ancestors of the taxa) C-B Stewart, NHGRI lecture, 12/5/00
X and Y are defined to be more closely related to each other than to Z if, and only if, they share a more recent common ancestor than they do with Z A C B D B A C D D C A B
A A C D D B C B B A B C C D D A C B D D A C B A All of these rearrangements show the same evolutionary relationships between the taxa Rooted tree 1a D C A B C-B Stewart, NHGRI lecture, 12/5/00
Three types of trees Cladogram groupings Taxon B Taxon C Taxon A Taxon D no meaning All show the same branching orders between taxa. C-B Stewart, NHGRI lecture, 12/5/00
Three types of trees Cladogram Phylogram groupings groupings + distance 6 Taxon B Taxon B 1 1 Taxon C Taxon C 3 1 Taxon A Taxon A Taxon D 5 Taxon D no meaning evolutionary distance All show the same branching orders between taxa. C-B Stewart, NHGRI lecture, 12/5/00
time Three types of trees Cladogram Phylogram Ultrametric tree groupings groupings + distance groupings + time 6 Taxon B Taxon B Taxon B 1 1 Taxon C Taxon C Taxon C 3 1 Taxon A Taxon A Taxon A Taxon D Taxon D 5 Taxon D no meaning Evolutionary distance All show the same branching orders between taxa. C-B Stewart, NHGRI lecture, 12/5/00
6 Taxon B 1 1 Taxon C (think lamprey) 3 1 Taxon A 5 Taxon D C is closer to A but more closely related to B Similarity vs. Evolutionary Relationship: Since taxa evolve at different rates, your closest relative could be very different This is why the closest BLAST hit is not necessarily the closest relative, and why you need to make trees. C-B Stewart, NHGRI lecture, 12/5/00
C C G G C G G C Types of Similarity Observed similarity between two entities can be due to: Evolutionary relationship: Shared ancestral characters (‘plesiomorphies’) Shared derived characters (‘’synapomorphy’) Homoplasy (independent evolution of the same character): Convergent events,Parallel events, Reversals G C C G T G C G
A few examples of what can be inferred from phylogenetic trees built from DNAor protein sequence data: • Which species are the closest living relatives of modern humans? • Did the infamous Florida Dentist infect his patients with HIV? • What were the origins of specific transposable elements? C-B Stewart, NHGRI lecture, 12/5/00
Which species are the closest living relatives of modern humans? Gorillas Chimpanzees Bonobos Orangutans Humans 0 15-30 MYA Classical view
Which species are the closest living relatives of modern humans? Molecular view Humans Gorillas Chimpanzees Chimpanzees Bonobos Bonobos Orangutans Gorillas Orangutans Humans 14 0 0 15-30 MYA MYA Classical view
No No Did the Florida Dentist infect his patients with HIV? DENTIST Phylogenetic tree of HIV sequences from the DENTIST, his Patients, & Local HIV-infected People: Patient C Patient A Patient G Yes: The HIV sequences from these patients fall within the clade of HIV sequences found in the dentist. Patient B Patient E Patient A DENTIST Local control 2 Local control 3 Patient F Local control 9 Local control 35 Local control 3 Patient D From Ou et al. (1992) and Page & Holmes (1998)
Uses of character mapping: • Dating adaptive evolutionary events • Ancestral reconstruction • Testing biological hypotheses of correlated function or change C-B Stewart, NHGRI lecture, 12/5/00
Ex: Where geographically was the common ancestor of African apes and humans? Scenario A: Africa as species fountain Scenario B: Eurasia as ancestral homeland Scenario B requires four fewer dispersal events Eurasia = Black Africa = Red = Dispersal Modified from: Stewart, C.-B. & Disotell, T.R. (1998) Current Biology 8: R582-588.
COMPUTATIONAL METHOD Optimality criterion Clustering algorithm PARSIMONY MAXIMUM LIKELIHOOD Characters DATA TYPE MINIMUM EVOLUTION LEAST SQUARES UPGMA NEIGHBOR-JOINING Distances Building Trees C-B Stewart, NHGRI lecture, 12/5/00
COMPUTATIONAL METHOD Optimality criterion Clustering algorithm PARSIMONY MAXIMUM LIKELIHOOD Characters DATA TYPE MINIMUM EVOLUTION LEAST SQUARES UPGMA NEIGHBOR-JOINING Distances Building Trees C-B Stewart, NHGRI lecture, 12/5/00
COMPUTATIONAL METHOD Optimality criterion Clustering algorithm PARSIMONY MAXIMUM LIKELIHOOD Characters DATA TYPE MINIMUM EVOLUTION LEAST SQUARES UPGMA NEIGHBOR-JOINING Distances Building Trees C-B Stewart, NHGRI lecture, 12/5/00
Types of data: Character-data: TaxaCharacters Species A ATGGCTATTCTTATAGTACG Species B ATCGCTAGTCTTATATTACA Species C TTCACTAGACCTGTGGTCCA Species D TTGACCAGACCTGTGGTCCG Species E TTGACCAGTTCTCTAGTTCG Distance-based data:pairwise distances (dissimilarities) A B C D E Species A ---- 0.20 0.50 0.45 0.40 Species B 0.23 ---- 0.40 0.55 0.50 Species C 0.87 0.59 ---- 0.15 0.40 Species D 0.73 1.12 0.17 ---- 0.25 Species E 0.59 0.89 0.61 0.31 ---- Uncorrected “p” distance Example 2: Kimura 2-parameter distance
COMPUTATIONAL METHOD Optimality criterion Clustering algorithm PARSIMONY MAXIMUM LIKELIHOOD Characters DATA TYPE MINIMUM EVOLUTION LEAST SQUARES UPGMA NEIGHBOR-JOINING Distances Building Trees C-B Stewart, NHGRI lecture, 12/5/00
Parsimony Given two trees, the one requiring the lowest number of character changes to explain the observations is the better Parsimony score for a tree is the minimum number of required changes This score is frequently referred to as number ofsteps or tree length
Parsimony – an example aacgtatgga bacgggtgca gaacggtgga daactgtgca a: c g: a a: c g: a a: c g: a b: c d: a d: a b: c b: c d: a Total tree length: 7 Total tree length: 8 Total tree length: 8
COMPUTATIONAL METHOD Optimality criterion Clustering algorithm PARSIMONY MAXIMUM LIKELIHOOD Characters DATA TYPE MINIMUM EVOLUTION LEAST SQUARES UPGMA NEIGHBOR-JOINING Distances Building Trees C-B Stewart, NHGRI lecture, 12/5/00
Using models A C G T A C G T , if i≠j A C G A G C , if i=j C T Example: Jukes-Cantor Observed differences Actual changes
Likelihood of a one-branch tree… 30 nucleotides from yh-globin genes of two primates on a one-edge tree * * Gorilla GAAGTCCTTGAGAAATAAACTGCACACTGG Orangutan GGACTCCTTGAGAAATAAACTGCACACTGG There are two differences and 28 similarities at at= 0.02327 lnL= -51.133956 lnL
A recipe for phylogenetic inference Collect your data Select an optimality criterion (“which tree is better?”, tree score) Optional: do data transformation (“corrections”) Select a search strategy to find the best tree Find the best hypothesis according to that criterion Assess the variation in your data in some way
Number of (rooted) trees 3 taxa -> 3 trees 4 taxa -> 15 trees 10 taxa -> 34 459 425 trees 25 taxa -> 1,19·1030 trees 52 taxa -> 2,75·1080 trees Finding the optimal tree is an NP-complete problem –Search strategies Exact Exhaustive Branch and bound Algorithmic Greedy algorithms, a.k.a. hill-climbing (including Neighbor-joining) Heuristic Systematic; branch-swapping (NNI, SPR, TBR) Stochastic Markov Chain Monte Carlo (MCMC) Genetic algorithms Finding the best tree
A A A B C E C E C D B B E D D Polytomy or multifurcation A bifurcation “Star-Decomposition” Completely unresolved or "star" phylogeny Partially resolved phylogeny Fully resolved, bifurcating phylogeny C-B Stewart, NHGRI lecture, 12/5/00
There are three possible unrooted trees on four taxa (A, B, C, D) Tree 1 Tree 2 Tree 3 A C A B A B D D C D B C C-B Stewart, NHGRI lecture, 12/5/00
A B A C C D B C D A E B C A D E B F The number of unrooted trees increases in a greater than exponential manner with number of taxa (2N - 5)!! = # unrooted trees for N taxa C-B Stewart, NHGRI lecture, 12/5/00
Efficiency Power Consistency Robustness Falsifiability – Time to find a/the solution – Rate of convergence/how much data are needed – Convergence to “correct” solution as data are added – Performance when assumptions are violated – Rejection of the model when inadequate What is a “good” method?
Performance on simulated data Frequency of correct inference Sequence length 0.30 and 0.05 respectively All 0.50
+ and – of the methods Pair-wise, NJ, distance approach + Fast (efficiency) + Models can be used to make distances (can be consistent) – pairwise distances throw out information (loss of power) – One will get a tree, but no score to compare with other trees or hypotheses Parsimony and tree-search + Philosophically appealing – Occam’s razor – Can be inconsistent – Can be computationally slow due to a huge number of possible trees Maximum likelihood and tree-search + Model-based, can be consistent, powerful, gain biological info – Model-based, bad when you have the wrong model – Computationally veeeeery slow due to heavy calculations in determining the tree score and a huge number of possible trees
The quick and dirty, pretty good tree Calculate model-based pairwise distances. Make a Neighbor-Joining Tree Do a bootstrap
A recipe for phylogenetic inference Collect your data Select an optimality criterion (“which tree is better”?) Optional: do data transformation (“corrections”) Select a search strategy to find the best tree Find the best hypothesis according to that criterion Assess the variation in your data in some way
Assessing the variation Jackknife – resampling without replacement Bootstrap – resampling with replacement
Assessing the variation Jackknife – resampling without replacement Bootstrap – resampling with replacement Resample columns from an alignment with replacement to make a simulated sample of the same size