Download
1 / 6
60 likes | 74 Views
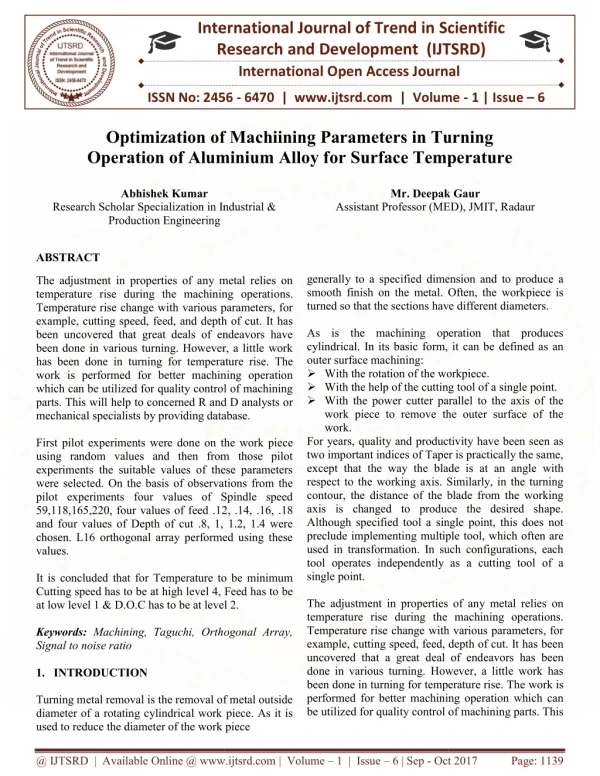
Stainless steel SS is used for many commercial and industrial applications owing to its high resistance to corrosion. It is too hard to machine due to its high strength and high work hardening property. A surface property such as surface roughness SR is critical to the function ability of machined components. Stainless steel is generally regarded as more difficult to machine material and poor SR is obtained during machining. In this paper an attempt has been made to investigate the SR produced by CNC turning on austenitic stainless steel AISI316 and martensitic stainless steel AISI410 by different cases of coated cutting tool used at dry conditions. Multi layered coated with TiCN Al2O3, multi layered coated with Ti C, N, B and single layered coated with TiAlN coated cutting tools are using. Experiments were carrying out by using Taguchi's L27 orthogonal array. The effect of cutting parameters on SR is evaluated and optimum cutting conditions for minimizing the SR are determined. Analysis of variance ANOVA is used for identifying the significant parameters affecting the responses. Confirmation experiments are conduct to validate the results obtaining from optimization. C. Amarnath | Mr. A. Harinath | Mr. N. Phani Raja Rao "Performance Evaluation of Coating Materials and Process Parameters Optimization for Surface Quality During Turning of Aisi 410 Austenitic Stainless Steel" Published in International Journal of Trend in Scientific Research and Development (ijtsrd), ISSN: 2456-6470, Volume-2 | Issue-6 , October 2018, URL: https://www.ijtsrd.com/papers/ijtsrd18748.pdf Paper URL: http://www.ijtsrd.com/engineering/mechanical-engineering/18748/performance-evaluation-of-coating-materials-and-process-parameters-optimization-for-surface-quality-during-turning-of-aisi-410-austenitic-stainless-steel/c-amarnath<br>

E N D
International Journal of Trend in International Open Access Journal International Open Access Journal | www.ijtsrd.com International Journal of Trend in Scientific Research and Development (IJTSRD) Research and Development (IJTSRD) www.ijtsrd.com ISSN No: 2456 SN No: 2456 - 6470 | Volume - 2 | Issue – 6 | Sep 6 | Sep – Oct 2018 Performance Evaluation of Coating Materials a Parameters Optimization for Surface Quality During Turning of Aisi of Aisi 410 Austenitic Stainless Steel 410 Austenitic Stainless Steel Performance Evaluation of Coating Materials and P Parameters Optimization for Surface Quality During Parameters Optimization for Surface Quality During nd Process C. Amarnath1, Mr. , Mr. A. Harinath2, Mr. N. Phani Raja Rao N. Phani Raja Rao2 1P PG. Scholar, 2Assistant Professor ateswara Institute of Technology, Anantapuram, Andhra Pradesh Sri Venkateswara Institute Andhra Pradesh, India ABSTRACT Stainless steel (SS) is used for many commercial and industrial applications owing to its high resistance to corrosion. It is too hard to machine due to its high strength and high work hardening property. A surface property such as surface roughness (SR) is critical to the function-ability of machined components. Stainless steel is generally regarded as more difficult to machine material and poor SR is obtained during machining. In this paper an attempt has been made to investigate the SR produced by CNC turning on austenitic stainless steel (AISI316) and martensitic stainless steel (AISI410) by different cases of coated cutting tool used at dry conditions. Multi coated with TiCN/Al2O3, multi-layered coated with Ti(C, N, B) and single layered coated with TiAlN coated cutting tools are using. Experiments were carrying out by using Taguchi’s L27 orthogonal array. The effect of cutting parameters on SR is evaluated and optimum cutting conditions for minimizing the SR are determined. Analysis of variance (ANOVA) is used for identifying the significant parameters affecting the responses. Confirmation experiments are conduct to validate the results obtaining from optimization. Keywords: CNC turning, AISI316, AISI410, Surface roughness, Taguchi’s Techniques, ANOVA. roughness, Taguchi’s Techniques, ANOVA. a healthy economy. Energy and materials are the two primary inputs required for the growth of any economy and these are obtained by exploiting the natural resources like fossil fuels and material ores. The industrial sector accounts for about one the world’s total energy consumption and the consumption of energy by this sector has almost doubled over the last 60 years (Fang et al.,). The consumption of critical raw materials (steel, aluminum, copper, nickel, zinc, wood, industrial use has increased worldwide. The rapid growth in manufacturing has created many economic, environmental and social problems from global warming to local waste disposal (Sangwan). There is a strong need, particularly, in emerging and developing economies to improve manufacturing performance so that there is less industrial pollution, and less material & energy consumption. Energy efficiency and product quality have become important benchmarks for assessing any industry. Manufacturing operations account for 37% of global energy demand (Diaz-Elsayed manufacturing industry annually consumes 21.1 quadrillion BTU energy (about 21% of total U.S. energy consumption) and generates more than 1.4 billion metric tons of CO 2 emissions (about 26% of total U.S. CO2 emissions) (Yuan et al.,). Machine tools have less than 30% efficiency (He et al.) and more than 99% of the Environmental impacts are due to the consumption of electrical energy used by the machine tools in discrete part manufacturing machining processes like turning and milling (Li et al.). Stainless steel (SS) is used for many commercial and industrial applications owing to its high resistance to corrosion. It is too hard to machine due to its high high work hardening property. A surface property such as surface roughness (SR) is critical to ability of machined components. a healthy economy. Energy and materials are the two primary inputs required for the growth of any economy and these are obtained by exploiting the tural resources like fossil fuels and material ores. The industrial sector accounts for about one-half of the world’s total energy consumption and the consumption of energy by this sector has almost doubled over the last 60 years (Fang et al.,). Stainless steel is generally regarded as more difficult to machine material and poor SR is obtained during g. In this paper an attempt has been made to investigate the SR produced by CNC turning on austenitic stainless steel (AISI316) and martensitic stainless steel (AISI410) by different cases of coated cutting tool used at dry conditions. Multi-layered umption of critical raw materials (steel, aluminum, copper, nickel, zinc, wood, etc.) for industrial use has increased worldwide. The rapid growth in manufacturing has created many economic, environmental and social problems from global ste disposal (Sangwan). There is a strong need, particularly, in emerging and developing economies to improve manufacturing performance so that there is less industrial pollution, and less material & energy consumption. Energy layered coated with Ti(C, N, B) and single layered coated with TiAlN Experiments were carrying out by using Taguchi’s L27 orthogonal array. The effect of cutting parameters y have become important timum cutting conditions benchmarks for assessing any industry. for minimizing the SR are determined. Analysis of variance (ANOVA) is used for identifying the significant parameters affecting the responses. Confirmation experiments are conduct to validate the Manufacturing operations account for 37% of global Elsayed manufacturing industry annually consumes 21.1 quadrillion BTU energy (about 21% of total U.S. rgy consumption) and generates more than 1.4 et et al.,). al.,). U.S. U.S. emissions (about 26% of emissions) (Yuan et al.,). Machine tools have less than 30% efficiency (He et al.) and more than 99% of the Environmental impacts are due consumption of electrical energy used by the machine tools in discrete part manufacturing machining processes like turning and milling (Li et CNC turning, AISI316, AISI410, Surface INTRODUCTION The 1980s have witnessed a fundamental change in the way governments and development agencies think about environment and development. The two are no longer regarded as mutually exclusive. It has been recognized that a healthy environment is essential for recognized that a healthy environment is essential for The 1980s have witnessed a fundamental change in the way governments and development agencies think about environment and development. The two are no onger regarded as mutually exclusive. It has been @ IJTSRD | Available Online @ www.ijtsrd.com www.ijtsrd.com | Volume – 2 | Issue – 6 | Sep-Oct 2018 Oct 2018 Page: 986
International Journal of Trend in Scientific Research and Development (IJTSRD) ISSN: 2456 International Journal of Trend in Scientific Research and Development (IJTSRD) ISSN: 2456 International Journal of Trend in Scientific Research and Development (IJTSRD) ISSN: 2456-6470 EXPERIMENTAL SETUP AND PLAN EXPERIMENTAL SETUP AND PLAN Introduction Predictive modeling selection of appropriate sets of machining parameters of the process. This can mainly be understanding the interrelationship among the large number of parameters affecting the process and identifying the optimal machining conditions. Experiments are performed on a given machine tool in order to understand the effect of different p parameters on performance characteristics roughness and power consumption. Material The sample material for the research is AISI 1045 steel. There is a renewed interest in the application of this steel because of its sustainability. It recyclable and almost has indefinite life cycle. AISI 1045 steel is one of the steel grades widely used in different industries (construction, automotive, power, etc.). Some of the commonly used components of 1045 steel are gears, shaft bolts, studs, connecting rods, spindles, rams, hydraulic pumps, etc. The chemical composition and mechanical properties of the AISI 1045 steel are given in Table 3.1 and Table 3.2 respectively. Therefore, 10 mm steps were provided on the work piece as shown in the figure. A pre depth was performed on each work actual turning using a different cutting tool. This was done in order to remove the rust or hardened top layer from the surface and to minimize any effect of no homogeneity on the experimental results. Table 1: Chemical composition of AISI 1045 steel in percentage weight Material C% Mn% AISI 1045 Steel 0.43 Worldwide, machine tool manufacturing is a USD 68.6 billion industry and very few energy assessments have been conducted for discrete manufacturing facilities (Diaz-Elsayed performance of machining processes can be achieved by reducing the power consumption (Camposeco Negrete,). If the energy consumption is reduced, the environmental impact generated production is diminished Sustainability performance may be reduced artificially by increasing the surface roughness as lower surface finish requires lesser power and resources to finish the machining. However, this may lead to more rejects, rework and time. Therefore, an optimum combination of power and surface finish is desired for sustainability performance of the machining processes. interdependence among productivity, quality and power consumption of a machine tool. The surface roughness is widely used index of product quality in terms of various parameters such as aesthetics, corrosion resistance, advantages, tribological considerations, fatigue life improvement, precision fit of critical mating surfaces, etc. But the achievement of a predefined surface roughness below certain limit generally increases power consumption exponentially and decreases the productivity. The capability of a machine tool to produce a desired surface roughness with minimum power consumption depends on machining phenomenon, work piece properties, cutting tool properties, etc. The first step towards reducing the power consumption and surface roughness in machining is to analyze the impact of machining parameters on power consumption and surface roughness. Worldwide, machine tool manufacturing is a USD 68.6 billion industry and very few energy assessments een conducted for discrete manufacturing Elsayed performance of machining processes can be achieved by reducing the power consumption (Camposeco- Negrete,). If the energy consumption is reduced, the act generated production is diminished Sustainability performance may be reduced artificially by increasing the surface roughness as lower surface finish requires lesser power and resources to finish the Predictive selection of appropriate sets of machining parameters of the process. This can mainly be achieved by understanding the interrelationship among the large number of parameters affecting the process and identifying the optimal machining conditions. Experiments are performed on a given machine tool in order to understand the effect of different process parameters on performance characteristics i.e. surface roughness and power consumption. modeling and and optimization optimization require require et et al.). al.). Sustainability Sustainability from from power al.,). al.,). power (Pusavec (Pusavec et et his may lead to more rejects, rework and time. Therefore, an optimum combination of power and surface finish is desired for sustainability The sample material for the research is AISI 1045 steel. There is a renewed interest in the application of this steel because of its sustainability. It is 100% recyclable and almost has indefinite life cycle. AISI 1045 steel is one of the steel grades widely used in different industries (construction, .). Some of the commonly used components of 1045 steel are gears, shafts, axles, bolts, studs, connecting rods, spindles, rams, . The chemical composition and mechanical properties of the AISI 1045 steel are given in Table 3.1 and Table 3.2 respectively. machining interdependence among productivity, quality and mption of a machine tool. The surface roughness is widely used index of product quality in terms of various parameters such as aesthetics, corrosion resistance, advantages, tribological considerations, fatigue life ion fit of critical mating surfaces, . But the achievement of a predefined surface roughness below certain limit generally increases power consumption exponentially and decreases the processes. There There is is a a close close transport, transport, subsequent subsequent processing processing Therefore, 10 mm steps were provided on the work ece as shown in the figure. A pre-cut of 1.5 mm depth was performed on each work piece prior to actual turning using a different cutting tool. This was done in order to remove the rust or hardened top layer from the surface and to minimize any effect of non- homogeneity on the experimental results. The capability of a machine tool to produce a desired surface roughness with minimum power consumption depends on machining piece properties, cutting tool . The first step towards reducing the power consumption and surface roughness in e the impact of machining parameters on power consumption and surface parameters, parameters, cutting cutting Table 1: Chemical composition of AISI 1045 steel in percentage weight Mn% P% s% Si% 0.7 0.7 0.04 0.05 0.16 Table 2: Mechanical properties of AISI 1045 steel Elastic modulus (Gpa) 205 205 Table 2: Mechanical properties of AISI 1045 steel modulus (Gpa) Strength (Mpa) 505 Density (kg/m3) 7.8 Yield Tensile Hardness Hardness (HB) 170 Elongation ratio 1.2 Material Strength (Mpa) 585 AISI 1045 Steel Cutting Tool Inserts and Holder Uncoated tungsten carbide tools were used for the experiments. The cutting tool used is proper for machining of AISI 1045 steel with ISO P25 quality. Sandvik inserts with the ISO TNMG 16 04 12 Sandvik inserts with the ISO TNMG 16 04 12 designation were mounted on the tool holder designated by ISO as PTGNR 2020 K16 having rake , clearance angle of 60 and 0.4 mm nose radius. An insert mounted on the tool holder is shown designation were mounted on the tool holder designated by ISO as PTGNR 2020 K16 having rake angle of 70, clearance angle of 6 radius. An insert mounted on the tool holder is shown in Figure. Uncoated tungsten carbide tools were used for the used is proper for machining of AISI 1045 steel with ISO P25 quality. @ IJTSRD | Available Online @ www.ijtsrd.com www.ijtsrd.com | Volume – 2 | Issue – 6 | Sep-Oct 2018 Oct 2018 Page: 987
International Journal of Trend in Scientific Research and Development (IJTSRD) ISSN: 2456 International Journal of Trend in Scientific Research and Development (IJTSRD) ISSN: 2456 International Journal of Trend in Scientific Research and Development (IJTSRD) ISSN: 2456-6470 Cutting speed (v), feed rate (f) and depth of the input parameters chosen for the research. The performance characteristics chosen to investigate the effect of machining parameters were surface roughness (Ra) and power consumption (P). Table 3.3 shows the three machining parameters and th levels for each parameter. Table 3: Machining parameters and their levels Level Level ) and depth of cut (d) are the input parameters chosen for the research. The performance characteristics chosen to investigate the effect of machining parameters were surface ) and power consumption (P). Table 3.3 shows the three machining parameters and the three Figure 1: Insert mounted on the tool holder Machine Tool The turning experiments were carried out in dry cutting conditions using an HMT centre lathe. It has a maximum spindle speed of 2300 rpm and spindle power of 5.5 kW. Work piece was held between chuck and tailstock; and the tool overhang was kept 20 mm to increase rigidity of the machining system as shown in Figure 2. Figure 1: Insert mounted on the tool holder Machine The turning experiments were carried out in dry cutting conditions using an HMT centre lathe. It has a Table 3: Machining parameters and their levels Level 2 Level 3 0 rpm and spindle piece was held between Factor Symbol 1 1 Cutting speed (m/min) Feed rate (mm/rev.) Depth of cut (mm) chuck and tailstock; and the tool overhang was kept 20 mm to increase rigidity of the machining system as 103.31 103.31 134.30 174.14 v 0.12 0.12 0.16 0.2 f 0.5 0.5 1.0 1.5 d Experimental Design In any experimental investigation, the results depend to a large extent on the data collection methodology. The most preferred method of experimentation utilized by researchers is a full factorial set of experiments, where experiments are carried out fo combinations of variables. A full factorial design of experiments (DOE) measures the response of every possible combination of factors and factor levels. These responses are analyzed to provide information about every main effect and every interactio The experimental design for three turning parameters (v, f, d) with three levels (33 Taguchi’s L27 orthogonal array as shown in orthogonal array as shown in Table. In any experimental investigation, the results depend to a large extent on the data collection methodology. The most preferred method of experimentation utilized by researchers is a full factorial set of experiments, where experiments are carried out for all combinations of variables. A full factorial design of experiments (DOE) measures the response of every possible combination of factors and factor levels. These responses are analyzed to provide information about every main effect and every interaction effect. The experimental design for three turning parameters Figure 2: Tool overhung and work piece clamped between chuck and tailstock The experiments were conducted by turning the work piece with feed direction towards the chuck of the lathe (referred to as “left feed direction”) as is often the case during conventional turning. SELECTION OF MACHINING PARAMETERS AND THEIR LEVELS The choice of machining parameters was made by taking into account the capacity/limiting cutting conditions of the lathe, tool manufacturer’s catalogue and the values taken by researchers in the literature. and the values taken by researchers in the literature. piece clamped ailstock The experiments were conducted by turning the work piece with feed direction towards the chuck of the lathe (referred to as “left feed direction”) as is often SELECTION OF MACHINING PARAMETERS The choice of machining parameters was made by taking into account the capacity/limiting cutting conditions of the lathe, tool manufacturer’s catalogue 3) are organized by the Table 4: An L Table 4: An L27 Orthogonal array Column Number 1 2 3 4 5 6 7 8 9 10 11 12 13 1 1 1 1 1 1 1 1 1 1 1 1 1 2 2 2 2 2 1 1 1 1 3 3 3 3 3 1 2 2 2 1 1 1 2 2 1 2 2 2 2 2 2 3 3 1 2 2 2 3 3 3 1 1 1 3 3 3 1 1 1 3 3 1 3 3 3 2 2 2 1 1 1 3 3 3 3 3 3 2 2 2 1 2 3 1 2 3 1 2 2 1 2 3 2 3 1 2 3 2 1 2 3 3 1 2 3 1 2 2 3 1 1 2 3 2 3 Experiment No. 1 2 3 4 5 6 7 8 9 10 11 12 13 1 1 1 1 1 1 1 1 1 1 2 2 2 2 13 1 2 3 2 3 1 3 1 2 3 1 2 1 1 2 3 3 1 2 2 3 1 1 2 3 3 1 2 3 3 1 2 2 3 1 2 3 1 1 1 2 3 3 1 2 2 3 1 3 1 2 2 @ IJTSRD | Available Online @ www.ijtsrd.com www.ijtsrd.com | Volume – 2 | Issue – 6 | Sep-Oct 2018 Oct 2018 Page: 988
International Journal of Trend in Scientific Research and Development (IJTSRD) ISSN: 2456 International Journal of Trend in Scientific Research and Development (IJTSRD) ISSN: 2456 International Journal of Trend in Scientific Research and Development (IJTSRD) ISSN: 2456-6470 14 15 16 17 18 19 20 21 22 23 24 25 26 27 2 2 2 2 2 3 3 3 3 3 3 3 3 3 3 3 2 1 3 2 1 2 1 2 2 3 1 2 3 1 3 1 2 2 3 1 3 1 2 1 2 2 3 1 2 1 2 3 3 1 2 3 1 2 2 3 1 1 2 2 3 1 2 3 1 2 2 3 3 1 3 2 1 3 2 1 3 3 1 3 2 2 1 3 2 1 3 1 3 2 3 2 1 3 2 3 2 1 3 1 3 2 2 1 3 2 1 3 2 1 3 3 2 3 2 1 3 3 2 1 1 3 3 3 2 1 1 3 2 3 2 3 3 2 1 2 1 3 1 3 2 3 2 3 1 2 3 1 3 1 2 1 2 3 1 2 2 3 1 1 2 3 3 1 2 2 3 1 2 3 3 1 2 3 1 2 2 3 1 1 2 3 3 1 1 2 3 2 3 1 1 2 3 3 1 2 Power Consumption Measurement The power consumption has been measured through the indirect method by measuring the cutting forces. In literature there are two methods – using wattmeter or power sensor. Both methods have their own advantages and limitations. The direct method measures exactly the power required by the machine tool "system" including auxiliary power. This research aims at developing a relationship between cutting parameters and process (power and surface roughness during cutting). The auxiliary power measurement does not add any value. An indirect method of power measurement by measuring the cutting forces was used to measure the power consumed during the experimentation. schematic to measure the forces is shown in Kistler 9272 dynamometer, shown in Figure, is used to capture the force signals during the cutting process in X, Y and Z directions (feed force, thrust force and cutting force). The dynamometer consis component force sensors fitted under high preload between a base plate and a top plate. Each sensor contains three pairs of quartz plates, one sensitive to pressure in the Z direction and the other two responding to shear in the X and Y directi The specifications of the dynamometer are illustrated in Table . The calibration of dynamometer is done by applying known weights and collecting the measured data. The load is varied from 0 to 1500 N in the Z direction. The calibration was done for b and unloading conditions, so that any hysteresis in the measurement can be observed. No hysteresis was observed for the cutting force calibration. The cutting tool was mounted on the top of the dynamometer. tool was mounted on the top of the dynamometer. The amplifier amplifies the electrical charges delivered from the dynamometer and converts them into proportional forces using data acquisition system and then these forces are processed using Dynoware software. The cutting force is obtained based on the average of steady state region values of cutting operation as shown in Figure 3.7. The data collected from an unsteady state can result in inaccurate values, which can affect the analysis. Out of the three force components, cutting force is used to calculate the power required to perform the machining operation. Power is the product of cutting force and cutting speed and is a better criterion for design and selection of any machine tools. The machining parameters and the corresponding measured cutting force and The amplifier amplifies the electri delivered from the dynamometer and converts them into proportional forces using data acquisition system and then these forces are processed using Dynoware software. The cutting force is obtained based on the average of steady state region value operation as shown in Figure 3.7. The data collected from an unsteady state can result in inaccurate values, which can affect the analysis. Out of the three force components, cutting force is used to calculate the power required to perform the Power is the product of cutting force and cutting speed and is a better criterion for design and selection of any machine tools. The machining parameters and the corresponding measured cutting force and calculated power values are giv calculated power values are given in Table. The power consumption has been measured through the indirect method by measuring the cutting forces. direct method or. Both methods have their own advantages and limitations. The direct method measures exactly the power required by the machine tool "system" including auxiliary power. This research aims at developing a relationship between cutting parameters and process performance (power and surface roughness during cutting). The auxiliary power measurement does not add any value. An indirect method of power measurement by measuring the cutting forces was used to measure the power consumed during the experimentation. The schematic to measure the forces is shown in Figure. Kistler 9272 dynamometer, shown in Figure, is used to capture the force signals during the cutting process in X, Y and Z directions (feed force, thrust force and cutting force). The dynamometer consists of three- component force sensors fitted under high preload between a base plate and a top plate. Each sensor contains three pairs of quartz plates, one sensitive to pressure in the Z direction and the other two responding to shear in the X and Y directions. Fig3. Kistler 9272 dynamometer Fig3. Kistler 9272 dynamometer Result & discussion The relative importance among the machining parameters (v, f, d) for the multiple performance characteristics (Ra and P) needs to be investigated so that the optimal parameters can be decid effectively. The analysis of variance (ANOVA) has been applied to investigate the developed model and the effect of machining parameters on the multi objective function. Table 6.5 shows ANOVA results for the linear [v, f, d,] quadratic [ interactive [(v × f), (v × d), (f which is a ratio of the regression mean square to the mean square error, is used to measure the significance of the model under investigation with respect to the variance of all the terms including the desired significance level. The relative importance among the machining ) for the multiple performance characteristics (Ra and P) needs to be investigated so that the optimal parameters can be decided effectively. The analysis of variance (ANOVA) has been applied to investigate the developed model and the effect of machining parameters on the multi- objective function. Table 6.5 shows ANOVA results ,] quadratic [v2, f2, d2] and ), (f × d)] factors. F-value, which is a ratio of the regression mean square to the mean square error, is used to measure the significance of the model under investigation with respect to the variance of all the terms including the error term at The specifications of the dynamometer are illustrated in Table . The calibration of dynamometer is done by applying known weights and collecting the measured data. The load is varied from 0 to 1500 N in the Z direction. The calibration was done for both loading and unloading conditions, so that any hysteresis in the measurement can be observed. No hysteresis was observed for the cutting force calibration. The cutting @ IJTSRD | Available Online @ www.ijtsrd.com www.ijtsrd.com | Volume – 2 | Issue – 6 | Sep-Oct 2018 Oct 2018 Page: 989
International Journal of Trend in Scientific Research and Development (IJTSRD) ISSN: 2456 International Journal of Trend in Scientific Research and Development (IJTSRD) ISSN: 2456 International Journal of Trend in Scientific Research and Development (IJTSRD) ISSN: 2456-6470 Table 5: Analysis of variance (ANOVA) for multi DF: Degree of freedom, SS: Sum of square, MS: Mean square DF: Degree of freedom, SS: Sum of square, MS: Mean square Seq. SS SS 0.6482 0.6482 0.0720 0.6272 0.6258 0.2086 108.07 0.000 0.0172 0.0157 0.0157 0.4199 0.4197 0.4197 217.41 0.000 0.1901 0.1904 0.1904 0.0204 0.0204 0.0068 0.0060 0.0060 0.0060 0.0142 0.0142 0.0142 0.0002 0.0002 0.0002 0.0007 0.0007 0.0002 0.0002 0.0002 0.0002 0.0004 0.0004 0.0004 0.0001 0.0001 0.0001 0.0328 0.0328 0.0019 0.681 R2(Pred.) = 0.8743R2(Adj.) = 0.9263 Table 5: Analysis of variance (ANOVA) for multi-objective function objective function Adj. Adj. MS % Source DOF F p contribution contribution 95.18 92.10 2.53 61.66 27.91 2.99 0.88 2.08 0.03 0.11 0.03 0.06 0.02 4.82 (Adj.) = 0.9263 Regression Linear V F D Square v*v f*f d*d Interaction v*f v*d f*d ResidualError Total R2= 0.9518 9 3 1 1 1 3 1 1 1 3 1 1 1 17 26 0.6482 0.6272 0.0172 0.4199 0.1901 0.0204 0.0060 0.0142 0.0002 0.0007 0.0002 0.0004 0.0001 0.0328 37.31 0.000 8.13 0.011 98.65 3.52 3.10 7.35 0.10 0.12 0.09 0.20 0.06 0.05 0.000 0.038 0.096 0.015 0.752 0.948 0.762 0.661 0.807 0.802 ) with 27.91% and cutting speed (v) with 2.53%. However, the percentage contribution of quadratic approaches unity, the response model fitness with the actual data improves. The obtained was 0.9518 which indicates that 95.18% of the total variations are explained by the is a statistic used to adjust the “size” of the model, i.e. the number of factors (machining parameters). The value of the R2 (Adj.) = 0.9263 indicating 92.63% of the total variability is explained by the model after considering the (Pred.) = 87.43% is in good (Adj.) and shows that the would be expected to explain 87.43% of the (d) with 27.91% and cutting speed ( However, the percentage contribution of quadratic term f2 is 2.08%.As R2 approaches unity, the response model fitness with the actual data impro value of R2 obtained was 0.9518 which indicates that 95.18% of the total variations are explained by the model. The adjusted R2 is a statistic used to adjust the “size” of the model, i.e. the number of factors (machining parameters). The value of 0.9263 indicating 92.63% of the total variability is explained by the model after considering the significant factors. R2(Pred.) = 87.43% is in good agreement with the R2(Adj.) and shows that the modelwould be expected to explain 87.43% variability in new data. Conclusions This study presents predictive and optimization models for the prediction and optimization of machining parameters leading to least power consumption and surface roughness during turning of AISI 1045 steel using tungsten carbide tools. Taguchi's orthogonal array to acquire the power consumption and surface roughness data. The developed predictive and optimization models based on experimental data, assist not only in analyzing the influence of the different proce two most dominant machining criteria, but are also useful for the optimality search of the various parametric combinations for achieving the maximum fulfillment of the objective requirements. fulfillment of the objective requirements. Figure 4: Percentage contribution of machining parameters on multi-objective function The p-value or probability value is used to determine the statistical significance of results at a confidence level. In this study the significance level of used, i.e. the results are validated for a confidence level of 95%. If the p-value is less than 0.05 then the corresponding factor has a statistically significant contribution to the performance characteristic and if the p-value is more than 0.05 then it means the eff of factor on the performance characteristic is not statistically significant at 95% confidence level. The results show that all linear terms and statistically significant at 95% level. The last column of the Table 6.5 shows the percentage con each term to the total variation indicating the degree of influence on the results. The percentage contribution of each term is also shown in Figure 6.3. Feed (f) was found to be the most significant machining parameter due to its highest pe contribution of 61.66% followed by the depth of cut contribution of 61.66% followed by the depth of cut rcentage contribution of machining objective function value or probability value is used to determine the statistical significance of results at a confidence level. In this study the significance level of α = 0.05 is he results are validated for a confidence value is less than 0.05 then the corresponding factor has a statistically significant contribution to the performance characteristic and if value is more than 0.05 then it means the effect of factor on the performance characteristic is not statistically significant at 95% confidence level. This study presents predictive and optimization models for the prediction and optimization of machining parameters leading to least power consumption and surface roughness during turning of The results show that all linear terms and f2 are statistically significant at 95% level. The last column of the Table 6.5 shows the percentage contribution of each term to the total variation indicating the degree of influence on the results. The percentage contribution of each term is also shown in Figure 6.3. tungsten carbide tools. Taguchi's orthogonal array to acquire the power consumption and surface roughness data. The developed predictive and optimization models based on experimental data, assist not only in analyzing the influence of the different process parameters on the two most dominant machining criteria, but are also useful for the optimality search of the various parametric combinations for achieving the maximum ) was found to be the most significant machining parameter due to its highest percentage @ IJTSRD | Available Online @ www.ijtsrd.com www.ijtsrd.com | Volume – 2 | Issue – 6 | Sep-Oct 2018 Oct 2018 Page: 990
International Journal of Trend in Scientific Research and Development (IJTSRD) ISSN: 2456 International Journal of Trend in Scientific Research and Development (IJTSRD) ISSN: 2456 International Journal of Trend in Scientific Research and Development (IJTSRD) ISSN: 2456-6470 REFERENCES 1.Kant, G., Sangwan, K.S., 2014. Prediction and optimization of machining minimizing power consumption and surface roughness in machining. Journal of Cleaner Production 83, 151–164. 2.Kant, G., Sangwan, K.S., 2015. Predictive modelling for power consumption in machining using artificial intelligence techniques. Procedia CIRP 26, 403–407. 3.Kant, G., Sangwan, K.S., 2015. Predictive modelling and optimization parameters to minimize surface roughness using parameters to minimize surface roughness using artificial neural network coupled with genetic algorithm. Procedia CIRP 31, 448 4.Kant, G., Sangwan, K.S., 2015. Predictive modelling for energy consumption in machining using artificial neural network. Procedia CIRP 37, 205–210. 5.Sangwan, K.S., Saxena, S., Kant, G., 2015. Optimization of machining minimize surface roughness using integrated ANN-GA approach. Procedia CIRP 29, 305 6.Kant, G., Rao V, V., Sangwan, K.S., 2013. Predictive modelling of turning operations using response surface methodology. Applied Mechanics and Materials 3 170–173. artificial neural network coupled with genetic m. Procedia CIRP 31, 448-453. . Prediction and optimization minimizing power consumption and surface roughness in machining. Journal of Cleaner of machining parameters parameters for for Kant, G., Sangwan, K.S., 2015. Predictive modelling for energy consumption in machining using artificial neural network. Procedia CIRP 37, Kant, G., Sangwan, K.S., 2015. Predictive modelling for power consumption in machining using artificial intelligence techniques. Procedia Sangwan, K.S., Saxena, S., Kant, G., 2015. Optimization of machining minimize surface roughness using integrated GA approach. Procedia CIRP 29, 305-310. par parameters to Kant, G., Sangwan, K.S., 2015. Predictive modelling and optimization Kant, G., Rao V, V., Sangwan, K.S., 2013. Predictive modelling of turning operations using response surface methodology. Applied Mechanics and Materials 307, of of machining machining @ IJTSRD | Available Online @ www.ijtsrd.com www.ijtsrd.com | Volume – 2 | Issue – 6 | Sep-Oct 2018 Oct 2018 Page: 991