Download
1 / 7
70 likes | 89 Views
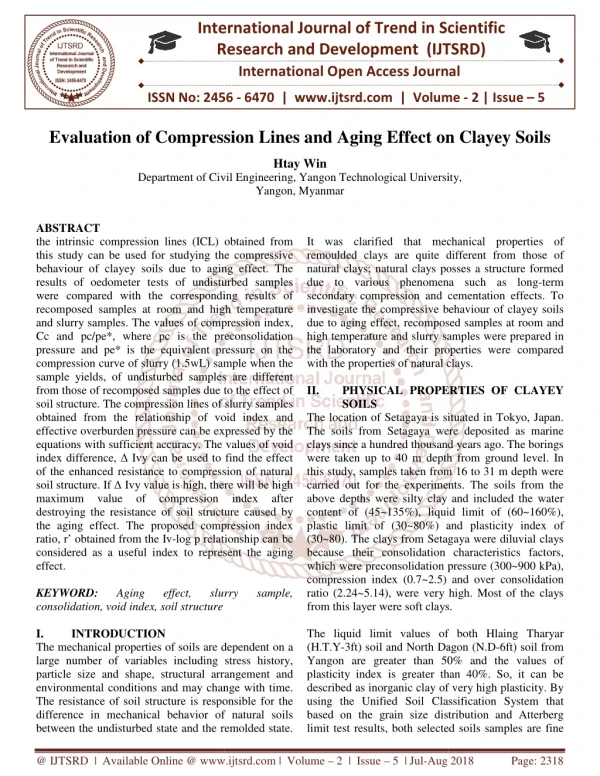
the intrinsic compression lines ICL obtained from this study can be used for studying the compressive behaviour of clayey soils due to aging effect. The results of oedometer tests of undisturbed samples were compared with the corresponding results of recomposed samples at room and high temperature and slurry samples. The values of compression index, Cc and pc pe , where pc is the preconsolidation pressure and pe is the equivalent pressure on the compression curve of slurry 1.5wL sample when the sample yields, of undisturbed samples are different from those of recomposed samples due to the effect of soil structure. The compression lines of slurry samples obtained from the relationship of void index and effective overburden pressure can be expressed by the equations with sufficient accuracy. The values of void index difference, Ivy can be used to find the effect of the enhanced resistance to compression of natural soil structure. If Ivy value is high, there will be high maximum value of compression index after destroying the resistance of soil structure caused by the aging effect. The proposed compression index ratio, r' obtained from the Iv log p relationship can be considered as a useful index to represent the aging effect. Htay Win "Evaluation of Compression Lines and Aging Effect on Clayey Soils" Published in International Journal of Trend in Scientific Research and Development (ijtsrd), ISSN: 2456-6470, Volume-2 | Issue-5 , August 2018, URL: https://www.ijtsrd.com/papers/ijtsrd18348.pdf Paper URL: http://www.ijtsrd.com/engineering/civil-engineering/18348/evaluation-of-compression-lines-and-aging-effect-on-clayey-soils/htay-win<br>

E N D
International Research Research and Development (IJTSRD) International Open Access Journal Compression Lines and Aging Effect on Htay Win Department of Civil Engineering, Yangon Technological University, Yangon, Myanmar International Journal of Trend in Scientific Scientific (IJTSRD) International Open Access Journal ISSN No: 2456 ISSN No: 2456 - 6470 | www.ijtsrd.com | Volume 6470 | www.ijtsrd.com | Volume - 2 | Issue – 5 Evaluation of Compression Lines n Clayey Soils Department of Civil Engineering, Yangon Technological University, Department of Civil Engineering, Yangon Technological University, ABSTRACT the intrinsic compression lines (ICL) obtained from this study can be used for studying the compressive behaviour of clayey soils due to aging effect. The results of oedometer tests of undisturbed samples were compared with the corresponding resul recomposed samples at room and high temperature and slurry samples. The values of compression index, Cc and pc/pe*, where pc is the preconsolidation pressure and pe* is the equivalent pressure on the compression curve of slurry (1.5wL) sample when th sample yields, of undisturbed samples are different from those of recomposed samples due to the effect of soil structure. The compression lines of slurry samples obtained from the relationship of void index and effective overburden pressure can be expres equations with sufficient accuracy. The values of void index difference, ∆ Ivy can be used to find the effect of the enhanced resistance to compression of natural soil structure. If ∆ Ivy value is high, there will be high maximum value of compression index after destroying the resistance of soil structure caused by the aging effect. The proposed compression index ratio, r’ obtained from the Iv-log p relationship can be considered as a useful index to represent the aging effect. KEYWORD: Aging effect, consolidation, void index, soil structure I. INTRODUCTION The mechanical properties of soils are dependent on a large number of variables including stress history, particle size and shape, structural arrangement and environmental conditions and may change with time. The resistance of soil structure is responsible difference in mechanical behavior of natural soils between the undisturbed state and the remolded state. between the undisturbed state and the remolded state. It was clarified that mechanical properties of remoulded clays are quite different from those of natural clays; natural clays posses a struc due to various phenomena such as long secondary compression and cementation effects. To investigate the compressive behaviour of clayey soils due to aging effect, recomposed samples at room and high temperature and slurry samples were prep the laboratory and their properties were compared with the properties of natural clays. II. PHYSICALPROPERTIES SOILS The location of Setagaya is situated in Tokyo, Japan. The soils from Setagaya were deposited as marine clays since a hundred thousand years ago. The borings were taken up to 40 m depth from ground level. In this study, samples taken from 16 to 31 m depth were carried out for the experiments. The soils from the above depths were silty clay and included the water content of (45~135%), liquid limit of (60~160%), plastic limit of (30~80%) and plasticity index of (30~80). The clays from Setagaya were diluvial clays because their consolidation characteristics factors, which were preconsolidation pressure (300~900 kPa), compression index (0.7~2.5) and over ratio (2.24~5.14), were very high. Most of the clays from this layer were soft clays. The liquid limit values of both Hlaing Tharyar (H.T.Y-3ft) soil and North Dagon (N.D Yangon are greater than 50% and t plasticity index is greater than 40%. So, it can be described as inorganic clay of very high plasticity. By using the Unified Soil Classification System that based on the grain size distribution and Atterberg limit test results, both selected limit test results, both selected soils samples are fine the intrinsic compression lines (ICL) obtained from this study can be used for studying the compressive behaviour of clayey soils due to aging effect. The results of oedometer tests of undisturbed samples were compared with the corresponding results of recomposed samples at room and high temperature and slurry samples. The values of compression index, Cc and pc/pe*, where pc is the preconsolidation pressure and pe* is the equivalent pressure on the compression curve of slurry (1.5wL) sample when the sample yields, of undisturbed samples are different from those of recomposed samples due to the effect of soil structure. The compression lines of slurry samples obtained from the relationship of void index and effective overburden pressure can be expressed by the equations with sufficient accuracy. The values of void Ivy can be used to find the effect of the enhanced resistance to compression of natural Ivy value is high, there will be high It was clarified that mechanical properties of remoulded clays are quite different from those of natural clays; natural clays posses a structure formed due to various phenomena such as long-term secondary compression and cementation effects. To investigate the compressive behaviour of clayey soils due to aging effect, recomposed samples at room and high temperature and slurry samples were prepared in the laboratory and their properties were compared with the properties of natural clays. PROPERTIESOFCLAYEY The location of Setagaya is situated in Tokyo, Japan. The soils from Setagaya were deposited as marine d thousand years ago. The borings were taken up to 40 m depth from ground level. In this study, samples taken from 16 to 31 m depth were carried out for the experiments. The soils from the above depths were silty clay and included the water 135%), liquid limit of (60~160%), plastic limit of (30~80%) and plasticity index of (30~80). The clays from Setagaya were diluvial clays because their consolidation characteristics factors, which were preconsolidation pressure (300~900 kPa), dex (0.7~2.5) and over consolidation ratio (2.24~5.14), were very high. Most of the clays from this layer were soft clays. ssion index after destroying the resistance of soil structure caused by the aging effect. The proposed compression index log p relationship can be considered as a useful index to represent the aging effect, slurry slurry sample, sample, The liquid limit values of both Hlaing Tharyar 3ft) soil and North Dagon (N.D-6ft) soil from Yangon are greater than 50% and the values of plasticity index is greater than 40%. So, it can be described as inorganic clay of very high plasticity. By using the Unified Soil Classification System that based on the grain size distribution and Atterberg The mechanical properties of soils are dependent on a large number of variables including stress history, particle size and shape, structural arrangement and environmental conditions and may change with time. The resistance of soil structure is responsible for the difference in mechanical behavior of natural soils @ IJTSRD | Available Online @ www.ijtsrd.com @ IJTSRD | Available Online @ www.ijtsrd.com | Volume – 2 | Issue – 5 | Jul-Aug 2018 Aug 2018 Page: 2318
International Journal of Trend in Scientific Research and Development (IJTSRD) ISSN: 2456-6470 grained soils and these soil are situated in CH group. The group name of both H.T.Y-3ft and N.D-6ft soils are also fat clay. The liquid limit values of Botahtaung, Kyanmaryae and Wardan Bridge dredged soil from Yangon are less than 50% and the values of plasticity index is greater than 7%. Therefore, it can be described as inorganic clay of low plasticity. The group symbol for clayey Soils from Yangon Mandalay Highway (YMH), North Dagon (ND) and Twante (TT) is CH and the group name of the soils is fat clay by using Unified Soil Classification system. III. PREPARATIONOFSOILSAMPLESAND TESTING In this study, fourteen soil samples obtained from 16 to 31 m depth of Setagaya were used for carrying out the experiments. These soil samples were divided into four groups (I~IV) on the basis of particle size distribution, natural water content and consistency limits. The depths of the group (I~IV) were 16~22, 22~26, 26~28 and 28~31 Recomposed samples, which were reconsolidated at room temperature (20 ºC) (RRT), were prepared for each soil group by remolding thoroughly the disturbed samples at water content of two times liquid limitand by sieving with 0.425 mm sieve. After deairing, the slurries were put into the cylinder and then were consolidated one dimensionally by applying firstly under the weight of the loading plate and then the incremental pressures 10, 20, 40, 80 and 160 kPa respectively. Each loading was applied for one day. After that, the average preconsolidation pressure of undisturbed samples (U) from each soil group was finally applied till the completion of consolidation. The procedure for preparing recomposed samples, which were reconsolidated at high temperature (70 ºC)(RHT), were the same as that for recomposed samples which were reconsolidated at room temperature (20 ºC) except the consolidating of the slurries in the steel cylinder, which was surrounded by the water with the controlled temperature at 70 ºC. After the completion of consolidation, the sample was unloaded and cooled at the room temperature (20 ºC). Slurry samples (S (1.5~4.0wL)) were obtained by mixing and sieving the disturbed samples with 0.425 mm sieve at water content of about 1.5, 2.0, 3.0 and 4.0 times of the liquid limit. The soils from 16 to 31 m depth of Setagaya were inorganic silty clays with high plasticity. Oedometer tests were performed for U, RRT, RHT and S (1.5~4.0wL) samples and unconfined compression tests were also carried out for U, RRT and RHT samples. The clayey soils from Hlaing Thar Yar (H.T.Y-3ft) and North Dagon (N.D-6ft) were mixed with different contents of sand and the compressive behaviour of these clay-sand mixtures was studied. This study is actually needed to find the compressive behaviour of various clay-sand mixtures slurries. In this research work, two types of soil samples with three different kinds of fine sand are tested. Index tests were done to find the physical properties of selected soils and consolidation tests were performed to get the consolidation characteristics of the clay-sand mixture slurries. The consolidation behaviour of dredged soils from Yangon River was studied for the consolidation behaviour to use in land reclamation projects. These locations of the study are Botahtaung jetty, Kyanmaryae jetty and Warden Bridge. In this research work, three types of soil samples that have the same liquid limit are tested for consolidation test. Index tests are done to find the physical properties of selected soils and consolidation tests are performed to get the consolidation characteristics of the soil samples. In this study, in order to find a reference line for the structure of clays and the linearity of the intrinsic compression curve, three disturbed clay soil samples were used from Yangon-Mandalay Highway road at 57 miles six furlong (YMH soil), North-Dagon township (ND soil) and Twan-Tay township (TT soil). These soil samples were mixed with water content at liquid limit in the laboratory and brought to a slurry state. Basic soil classification tests and oedometer test were performed IV. CONSOLIDATIONCHARACTERISTICS OFCLAYEYSOILS Fig. 1 shows the relationship between void ratio and log p for U, RRT, RHT and S (1.5~4.0wL) samples. The initial void ratios of U samples are higher than those of RRT and RHT samples and lower than those of S (1.5~4.0wL) samples. The compression curves of S samples fall down straightly after yielding at the consolidation pressure of 10~20 kPa. In the over consolidated region, the compression curve of U samples crosses the compression line of S samples with a little slope till the preconsolidation pressure, pc. When the consolidation pressure exceeds the pc well, m respectively. @ IJTSRD | Available Online @ www.ijtsrd.com | Volume – 2 | Issue – 5 | Jul-Aug 2018 Page: 2319
International Journal of Trend in Scientific Research and Development (IJTSRD) ISSN: 2456-6470 the clay becomes ductile because the clay structure having been formed by aging effect is destroyed by the consolidation under the pressure far over pc. The compression behavior of aged clay around the yield stress is unstable, which depends on the magnitude of aging. Compressibility of such aged clay through loading is much higher at the stage during destruction of the structure than after the destruction. Therefore, the compression curve of U samples falls down steeply after yielding. But, when the consolidation pressure becomes large, the slope of the compression curve is reduced, stable and will coincide with the compression line of S-samples. Remoulding and reconsolidating of soil samples tend to destroy the original soil structure so that the compression curves of RRT and RHT samples appear more gently smoother than those of U samples without having well defined break point. The post yield compression curves of RRT and RHT samples are either parallel or coincide with the compression curves of S samples when the consolidation pressure is large. The preconsolidation pressure, pc of RRT and RHT samples is approximately the same for each other and is not much different with that of corresponding U samples in each soil group. Cc values of U samples are in the range of 0.7 to 2.5. The maximum Cc values of U samples are occurred very rapidly when the consolidation pressure is about 1.3~2.3 times of the corresponding pc value. Cc values of RRT and RHT samples are ranging from 0.4 to 1.2. When the water content increases from 1.5wL to 4wL for slurry samples, the slope of the compression curves become steeper and Cc value of S (2.0, 3.0, 4.0wL) samples is increased about 1.1, 1.2 and 1.25 times of S (1.5wL) samples. The maximum compression index values of U samples are 1.2~2.5 times greater than those of RRT, RHT and S (1.5~4.0wL) samples because natural soils are different from the corresponding recomposed and slurry samples with respect to fabric and bonding. Fig.2 e-log p curve of clay-sand mixtures (H.T.Y.) Fig.3 e-log p curve of clay-sand mixtures (N.D.) Fig. 2 and 3 show the relationship between void ratio and log p for Clay-Sand Mixtures of H.T.Y. and N.D. soils. It can be seen that the compression curves fall down straightly when consolidation pressure increases because the soil structure is already destroyed. If sand content in clay-sand mixtures increases, the void ratio becomes less. The slope of the compression curves are approximately the same because the compression lines are parallel to each other. Fig. 4 and 5 show the relationship between void ratio and log p for dredged soils and slurry soils. The nature of the compression lines are the same as that of clay-sand mixtures. Fig. 1 e-log p curve of clay from Setagaya Fig.4 e-log p curve of dredged soils @ IJTSRD | Available Online @ www.ijtsrd.com | Volume – 2 | Issue – 5 | Jul-Aug 2018 Page: 2320
International Journal of Trend in Scientific Research and Development (IJTSRD) ISSN: 2456-6470 ( * 100 e ) ( ) − − * 100 e − * 100 e e e = = I ( ) --- (1) v * 1000 e * c C e*100 and e*1000 are the void ratios when the consolidation pressure are 100 kPa and 1000 kPa respectively. c C is the compression index of reconstituted clay. The ICL can be expressed by the following equation (Burl and, 1990). ( . 0 log 285 . 1 45 . 2 p Iv + − = Fig. 7 shows the relationship of void index and log p for the oedo meter compression curves of U, RRT, RHT and S (1.5~4.0wL) samples from Setagaya. When the consolidation pressure is not more than 70 kPa, the compression lines of S (1.5~4.0wL) samples lie slightly below ICL. After applying over that pressure, the compression lines of S (1.5~4.0wL) samples are on the same line with ICL. The void index values of U, RRT and RHT samples are calculated by using e*100 and Cc* values from the corresponding e-log p curve of S (1.5wL) samples. The compression curves of U samples cross the compression line of S (1.5wL) sample and then yield. All the post yield compression curves of U samples are much steeper than SCL and will converge slowly on the compression line of S (1.5wL) sample when the consolidation pressure is much higher than the consolidation yield stress. The compression curve of RRT and RHT samples lie below that of S (1.5wL) sample. All the post yield compression curves of U samples are much steeper than SCL and will converge slowly on the compression line of S (1.5wL) sample when the consolidation pressure is much higher than the consolidation yield stress. The compression curve of RRT and RHT samples lie below that of S (1.5wL) sample. The post yield compression curve of RRT and RHT samples is smooth and will be parallel to the compression line of S (1.5wL) sample. 2 * ) ( )3 Fig. 5 e-log p curve of slurry soils 015 log p --- (2) The ratio pc/pe*, where pc is the preconsolidation pressure of natural clay and pe* is the equivalent pressure on the compression curve of S (1.5wL) samples when natural clay yields, is a measure of the enhanced resistance to compression caused by the natural microstructure (Burl and, 1996). The typical compression curves of U, R and S (1.5wL) sample is shown in Fig. 6. The higher the pc/pe* values, the effect of the resistance of natural soil structure will be higher. It is found that if the pc/pe* value of U samples is high in each soil group; Cc value will also be high. The values of Cc and pc/pe* of U samples are greater than those of RRT and RHT samples due to the difference of resistance to compression of soil structure caused by the aging effect. Fig. 6 Typical compression curves v. RELATIONSHIP INDEXANDEFFECTIVEVERTICAL STRESSFORDILUVIALCLAY Burl and (1990) proposed the intrinsic compression line (ICL) and sedimentation compression line (SCL) for studying the compression characteristics of natural soils. Burl and showed that most of the compression curves of e-log p relationship of reconstituted clays having water content 1.0~1.5wL can be normalized into a unique line by using the normalizing parameter Iv (void index) defined by the two constants of intrinsic compressibility e*100 and Cc* as follows. BETWEEN VOID Fig. 7 Iv-log p curve of clay from Setagaya @ IJTSRD | Available Online @ www.ijtsrd.com | Volume – 2 | Issue – 5 | Jul-Aug 2018 Page: 2321
International Journal of Trend in Scientific Research and Development (IJTSRD) ISSN: 2456-6470 The slurry samples having same water content of clayey soils can be represented with a unique compression line as shown in Fig. 8, 9, 10 and 11. These compression lines can be represented with sufficient accuracy in the form of equation as shown below. ( ) ( )( log log c p b a Iv − − = The values of the coefficients (a, b, c and d) of slurry samples can be seen in Fig. The coefficients of correlation for the above equations are within 0.994 to 0.999. An equation can be derived to calculate the value of pc/pe* from the Iv-log p graph illustrated in Fig. 12. The compression index of the S (1.5wL) sample can be written as below. I I C − ) ( )( ) ( )( d )3 2 + log p p - (3) Fig. 8 Compression lines of slurry from Setagaya ∆ I − vy p = = ' 1 2 v v c * e log log p p c c log * e p ∆ I p vy = c log * e ' p C c Fig. 9 Compression lines of clay-sand mixtures ∆ I vy p ' C = c 10 --- (4) c * e p Where, Cc’ = the compression index of S (1.5wL) sample from Iv-log p graph ∆ Ivy = the void index difference between U, RRT and RHT samples and S (1.5wL) samples at the yield point of U, RRT and RHT samples In this study, pc and pe* values are within 40 kPa to 900 kPa. In this consolidation pressure range, Cc’ value of S (1.5wL) sample is in the range of 0.95 to 1.015. If the value of Cc’ is assumed as 1, equation (4) can be simplified in the form of ( vy I c p According to the above equation, ∆ Ivy is a useful index and if its value is high, the resistance to compression of natural soil structure due to aging effect will be high. Fig. 10 Compression lines of dredged soils p ) ∆ =10 --- (5) * e Fig. 11 Compression lines of slurry soils @ IJTSRD | Available Online @ www.ijtsrd.com | Volume – 2 | Issue – 5 | Jul-Aug 2018 Page: 2322
International Journal of Trend in Scientific Research and Development (IJTSRD) ISSN: 2456-6470 ' C r = . max . c C ' --- (6) *' c Where, R’ = compression index ratio ' . max . c C = maximum compression index of U, RRT and RHT samples obtained from Iv-log p graph *' c C = compression index of the compression line of S (1.5wL) sample at which consolidation pressure is five times of the consolidation pressure at r’ values are calculated by using the Iv-log p graph as shown in Fig. 14. For diluvial clay from Setagaya, r’ values of U samples are in the range of 1.7 to 2.7 while those of RRT and RHT samples are approximately the same and are ranging from 1.2 to 1.6. r’ values of diluvial clay from Setagaya are consistent with the compression index values, rc (Tsuchida, 1991)of Japanese alluvial marine clays which are ranging from 1.1 to 3.0. r’ values of U samples are different from those of the corresponding RRT and RHT samples due to the effect of natural soil structure. From the relationship between r’ and pc/pe*shown in Fig. 15, it can be concluded that the values of r’ will be high if the existing effect of the resistance of natural soil structure is high. Fig. 12 Typical compression curves ' C . c max . Fig. 13 Relationship between C’cmax, and ∆ Ivy In Fig. 13, it can be seen that the maximum compression index of the clays during destruction of the aged soil structure becomes high with the increasing of the value of ∆ Ivy. Therefore, the compressibility of the aged clay around the yield stress depends on the magnitude of aging. The difference of the values of C’cmax and ∆ Ivy between U samples and RRT and RHT samples are due to the effect of aging. The clay in-situ can resist the additional resistance until yielding due to the aging effect. After yielding, the value of Cc of the aged clay is very high during destroying the additional soil structure developed by aging effect. According to many researchers, the value of Cc of aged clays becomes almost constant when the consolidation pressure is about 5 times of the yield pressure. In others word, when the consolidation pressure becomes large in the normally consolidated region, the compression index of U samples will be approximately the same as that of RRT, RHT and S samples. Because of having a unique compression line of S (1.5wL) samples in Iv- log p curve, it is useful to express the aging effect. To represent the aging effect, the proposed compression index ratio, r’ will be defined as follows. Fig. 14 Relationship between Cc’ and consolidation pressure of group (III) Fig. 15 r’and pc/pe* relationship @ IJTSRD | Available Online @ www.ijtsrd.com | Volume – 2 | Issue – 5 | Jul-Aug 2018 Page: 2323
International Journal of Trend in Scientific Research and Development (IJTSRD) ISSN: 2456-6470 VI. This study investigated the aging effect on the consolidation characteristics and compressive strength behaviour of clayey soils by comparing the results of oedo meter test of U samples with that of corresponding RRT, RHT and S (1.5~4.0 wL) samples. The results obtained in this study can be summarized as follows. (a)The Cc values of U samples are 1.2~2.5 times greater than those of RRT, RHT and S (1.5~4.0wL) samples. The values of Cc and pc of RHT samples are approximately the same as those of RRT samples. Cc value of S (2.0, 3.0, 4.0wL) samples is about 1.1, 1.2 and 1.25 times of S (1.5wL) samples. (b)The difference of pc/pe* values between U samples and RRT and RHT samples is due to the effect of the resistance to compression of natural soil structure. If the pc/pe* value is high in each soil group having same physical properties, the compression index value also becomes high. (c)The compression lines of slurry samples of diluvial clay are consistent with the intrinsic compression line (ICL) proposed by Burl and (1990), when the consolidation pressure is more than 70 kPa. These compression lines can be expressed by the equations with sufficient accuracy. (d)The value of ∆ Ivy can also be used to find the effect of the resistance of natural soil structure and if this value is high, the maximum compression index of the soil samples during destruction of the aged soil structure will become high. (e)The proposed compression index ratio, r’ can be considered as a useful index to represent the aging effect. r’ values of U samples are different from those of the corresponding RRT and RHT samples due to the effect of natural soil structure and will be high if there exists the more effect of enhanced resistance to compression of soil structure. CONCLUSION ACKNOWLEDGEMENT The author owes a debt of gratitude to Dr. Nyan Myint Kyaw, Professor and Head of the Department of Civil Engineering, University, for his kind support. The author would like to express his heartfelt thanks to his supervisor, Associate Professor Hidehiko Engineering Department of Saitama University, Japan, for his enthusiastic instruction, invaluable help, and indispensable guidance in this study. Finally, the author wishes to express his heartfelt thanks to his family for their supports and encouragements to attain his destination without any trouble. REFERENCES 1.Bjerrum, L, “Engineering Geology of Norwegian Normally Consolidated Marine Clays as related to Settlements of Buildings”, Geotechnique, Vol. 17, pp. 81-118, 1967. 2.Burl and, J.B, “On the Compressibility and Shear Strength of Natural Clays”, Geotechnique, Vol. 40, No. 3, pp. 329-378, 1990. 3.Burl and, J.B., “A Laboratory Study of the Strength of Four Stiff Clays”, Geotechnique, Vol. 46, No. 3, pp. 491-514, 1996. 4.Leroueil et al, “Behavior of Destructured Natural Clays” ASCE, Vol. 99, no. GT6, pp. 123-127, 1979. 5.Mesri, G, “Coefficient Compression”, Journal of the Soil Mechanics and Foundations Division, ASCE. Vol. 99, No. SM1, pp. 123-137, 1973. 6.Tsuchida et al, “Effect of Aging of Marine Clay and its duplication by High Temperature Consolidation”, Soils and Foundations, Vol. 31, No. 4, pp. 131-147, 1991. Yangon Technological Kazama, Civil of Secondary @ IJTSRD | Available Online @ www.ijtsrd.com | Volume – 2 | Issue – 5 | Jul-Aug 2018 Page: 2324