Download
1 / 8
80 likes | 91 Views
The paper underlines the use of quantitative analyses and mathematical models to optimize the decision within companies from oil and gas industry. It will be presented a case study from a refinery that use RPMS Refinery and Petrochemical Modeling System software for optimizing LPG blends. Catalin Popescu "Decisions Optimization Related to the Production Within Refining and Petrochemical Industry" Published in International Journal of Trend in Scientific Research and Development (ijtsrd), ISSN: 2456-6470, Volume-3 | Issue-1 , December 2018, URL: https://www.ijtsrd.com/papers/ijtsrd20189.pdf Paper URL: http://www.ijtsrd.com/management/operations-management/20189/decisions-optimization-related-to-the-production-within-refining-and-petrochemical-industry/catalin-popescu<br>

E N D
International Journal of Trend International Open Access Journal International Open Access Journal | www.ijtsrd.com International Journal of Trend in Scientific Research and Development (IJTSRD) Research and Development (IJTSRD) www.ijtsrd.com ISSN No: 2456 ISSN No: 2456 - 6470 | Volume - 3 | Issue – 1 | Nov 1 | Nov – Dec 2018 Decisions Optimization Related Within Refining a Within Refining and Petrochemical Industry nd Petrochemical Industry Decisions Optimization Related to the Production the Production Cătălin Popescu Business Administration Department, Business Administration Department, Petroleum-Gas University Gas University of Ploieşti, Ploieşti, Romania ABSTRACT The paper underlines the use of quantitat and mathematical models to optimize the decision within companies from oil and gas industry. It will be presented a case study from a refinery that use RPMS (Refinery and Petrochemical Modeling System) software for optimizing LPG blends. Key Words: mathematical models, optimal solution, computer software, RPMS, oil and gas industry I. INTRODUCTION Many organizational problems requiring different managerial decisions have to call quantitative analyses defined by Management science relies modeling, a process that transforms some observed phenomena into mathematical expressions. Also, mathematical models translate important business problems into a form suitable for determining an optimal solution by using compute Building useful mathematical models is a difficult and complex task and is related with the entire management science process. This paper is focused on the subjects connected to the petroleum industry. This domain is linked to large projects and has to focus to use a team approach that capitalizes on the talents of the management science analyst as well as those coming from other relevant business disciplines. For instance, the models defining oil industry involve the purchase of crude oil manufacture and distribution of various grades of gasoline (upstream, middle-stream and down processes) [1]. In this regard, the team responsible for building the model and evaluating its results could consist of some of the following: chem economist, marketing analyst, financial officer, accountant, production manager or transportation specialist [1]. To facilitate and integrate the use of mathematical models in the decision processes, in different and complex industrial acti powerful computer tools. II. Tools for optimizing the decision There are more than 20 commercially licensed languages and solvers used for optimization: AMPL, CPLEX, Excel Solver, GAMS, IMSL, MATLAB, MATHCAD, SAS, SCIP etc. For instance, Exce Solver Function is a Microsoft Excel add be used for evaluation analyzes. The solution will be used to find the optimal (maximum or minimum) value for a formula in a cell, called the objective cell, taking into account constraints or limit va cell types with formulas within the worksheet. The solver works with a group of cells, called decision variables or just variable cells, which are used to calculate formulas in objective and constrained cells. The solution adjusts values in d meet boundaries imposed in constrained cells and produces the desired result in the objective cell [2]. produces the desired result in the objective cell [2]. The paper underlines the use of quantitative analyses and mathematical models to optimize the decision within companies from oil and gas industry. It will be presented a case study from a refinery that use RPMS (Refinery and Petrochemical Modeling System) oil industry involve the purchase of crude oil and the manufacture and distribution of various grades of stream and down-stream processes) [1]. In this regard, the team responsible for building the model and evaluating its results could consist of some of the following: chemical engineer, economist, marketing analyst, financial officer, accountant, production manager or transportation specialist [1]. To facilitate and integrate the use of mathematical models in the decision processes, in different and complex industrial activities, are used mathematical models, optimal solution, computer software, RPMS, oil and gas industry Many organizational problems requiring different managerial decisions have to call quantitative analyses defined by ence modeling, a process that transforms some observed phenomena into mathematical expressions. Also, mathematical models translate important business problems into a form suitable for determining an optimal solution by using computer software. Building useful mathematical models is a difficult and complex task and is related with the entire management on relies management on science. science. Tools for optimizing the decision There are more than 20 commercially licensed languages and solvers used for optimization: AMPL, CPLEX, Excel Solver, GAMS, IMSL, MATLAB, MATHCAD, SAS, SCIP etc. For instance, Excel Solver Function is a Microsoft Excel add-in that can be used for evaluation analyzes. The solution will be used to find the optimal (maximum or minimum) value for a formula in a cell, called the objective cell, taking into account constraints or limit values in other cell types with formulas within the worksheet. The solver works with a group of cells, called decision variables or just variable cells, which are used to calculate formulas in objective and constrained cells. The solution adjusts values in decision-makers cells to meet boundaries imposed in constrained cells and mathematical mathematical This paper is focused on the subjects connected to the petroleum industry. This domain is linked to large and has to focus to use a team approach that capitalizes on the talents of the management science analyst as well as those coming from other relevant business disciplines. For instance, the models defining @ IJTSRD | Available Online @ www.ijtsrd.com www.ijtsrd.com | Volume – 3 | Issue – 1 | Nov-Dec 2018 Dec 2018 Page: 1094
International Journal of Trend in Scientific Research and Development (IJTSRD) ISSN: 2456 International Journal of Trend in Scientific Research and Development (IJTSRD) ISSN: 2456 International Journal of Trend in Scientific Research and Development (IJTSRD) ISSN: 2456-6470 Fig.1 Set parameters in Excel Solver Function (capture from Microsoft Excel 2016) Fig.1 Set parameters in Excel Solver Function (capture from Microsoft Excel 2016) Fig.1 Set parameters in Excel Solver Function (capture from Microsoft Excel 2016) The solver methods used by Solver are as 1.Generalized Reduced Gradient (GRG) Nonlinear is used for non-linear problems; 2.Linear Programming Simplex is used for linear problems; 3.Evolutionary is used for strong non [2]. Another example is represented by FICO Xpress Optimization. The broad portfolio of FICO Xpress Optimization, in terms of optimization options, allows users to build, place and use optimization solutions that meet the requirements. The standard package includes performance solvers and algorithms, flexible modeling environments, fast application development, comparative scenario study and reporting capabilities and cloud installations. Solving a wide range of issues may be the difference between success and failure in today's market environment. today's market environment. The solver methods used by Solver are as follows: Generalized Reduced Gradient (GRG) Nonlinear Optimization allows companies to solve their most difficult problems faster. consists of four components: 1.FICO Xpress Insight enables companies to quickly implement optimization models as powerful applications. This allows companies and other users to work with patterns in easy understand terms; 2.FICO Xpress Executor provides independent support for execution optimization services, enabling companies optimization models quickly and easily; 3.FICO Xpress Solver offers the wide industry-leading optimization algorithms and technologies to solve linear, mixed and nonlinear numerical problems; 4.FICO Xpress Workbench is an integrated development environment optimization models, services and solutions. optimization models, services and solutions. zation allows companies to solve their most Xpress Optimization Linear Programming Simplex is used for linear FICO Xpress Insight enables companies to quickly implement optimization models as powerful applications. This allows companies and users to work with patterns in easy-to- Evolutionary is used for strong non-linear issues Another example is represented by FICO Xpress The broad portfolio of FICO Xpress Optimization, in terms of optimization options, allows users to build, place and use optimization solutions that meet the requirements. The standard package includes performance solvers and algorithms, flexible g environments, fast application development, comparative scenario study and reporting capabilities Solving a wide range of issues may be the difference between success and failure in FICO Xpress Executor provides independent support for execution optimization services, enabling companies optimization models quickly and easily; FICO Xpress Solver offers the widest range of leading optimization algorithms and technologies to solve linear, mixed and nonlinear to to deploy deploy and and run run FICO Xpress Workbench is an integrated development environment for for developing developing FICO® FICO® Xpress Xpress @ IJTSRD | Available Online @ www.ijtsrd.com www.ijtsrd.com | Volume – 3 | Issue – 1 | Nov-Dec 2018 Dec 2018 Page: 1095
International Journal of Trend in Scientific Research and Development (IJTSRD) ISSN: 2456 International Journal of Trend in Scientific Research and Development (IJTSRD) ISSN: 2456 International Journal of Trend in Scientific Research and Development (IJTSRD) ISSN: 2456-6470 FICO® Xpress Workbench supports and is used with all other FICO Xpress Optimization components [3]. Xpress Workbench supports and is used with all other FICO Xpress Optimization once a week, a meeting will be held with the staff involved in production and delivery management. once a week, a meeting will be held with the staff involved in production and deliv The demand for liquefied petroleum gas (LPG) is strongly influenced by the market price of gasoline (the LPG car being the alternative to gasoline for internal combustion engines adapted to the use of LPG) and has a pronounced seasonal cha the summer period the demand for LPG increases and decreases during the winter period[5]. The refinery produces 3 types of liquefied petroleum gas (LPG): automotive LPG, LPG type 3 and propylene, based on 4 components: propane, propylene, pro and butane. The properties of the LPG components and their specifications are presented in Tables I and II [6]. III. The demand for liquefied petroleum gas (LPG) is strongly influenced by the market price of gasoline (the LPG car being the alternative to gasoline for internal combustion engines adapted to the use of LPG) and has a pronounced seasonal character, so in the summer period the demand for LPG increases and decreases during the winter period[5]. The refinery produces 3 types of liquefied petroleum gas (LPG): automotive LPG, LPG type 3 and propylene, based on 4 components: propane, propylene, propane- butane and butane. The properties of the LPG components and their specifications are presented in Tables I and Case study regarding the Implementation of RMPS software for optimizing LPG blends The RPMS software is used for strategic (long medium and current (short term) planning. The recursive linear sequential recursive method is used to search for the solution of optimized production planning problems in RPMS systems [4]. To make the decision known to other organizational structures involved in the production process, economic and logistic analysis, RPMS generates a series of .xls (EXCEL) reports. In order to control the fulfillment of the production plan at least control the fulfillment of the production plan at least Case study regarding the Implementation of RMPS software for optimizing LPG blends The RPMS software is used for strategic (long-term), term) planning. The recursive recursive method is used to search for the solution of optimized production planning problems in RPMS systems [4]. To make the decision known to other linear sequential programming programming (LP) (LP) the production process, economic and logistic analysis, RPMS generates a series of .xls (EXCEL) reports. In order to TABLE I LPG components and properties TABLE I LPG components and properties Properties %gr Flow Production, t Total, %gr C3´, %gr 100% 100% 100% C2, %gr C3, %gr C4, %gr C5, %gr Total, %gr 2% 96% 2% 1% 97% 2% 1% 40% 58% 0% 3% 95% Propane Propylene Propane-butane Butane TOTAL 3000 4000 800 12200 20000 0% 0% 1% 2% 100% 100% 100% 100% 100% 4% 96% 0% 2% TABLE II Specifications for LPG for cars, LPG type 3 and propylene LPG for ca min %gr C2 C3 36% C4 C5 C3’ 12% TABLE II Specifications for LPG for cars, LPG type 3 and propylene TABLE II Specifications for LPG for cars, LPG type 3 and propylene LPG for cars max %gr min %gr max %gr min %gr max %gr 1% 60% 2% LPG type 3 Propylene Propylene Component max %gr 1% 35% 3% 35% 95% Depending on the market demand and the season, the price of liquefied petroleum gas may vary. In the ab of logistical and production limitations, the refinery will maximize production of one of three types of LPG products at the expense of other types to maximize the profit. In the following, it will be analyzed situations in which the price of one of from one another, thus influencing the decision to add propylene to the LPG auto in order to optimize LPG mixtures. Changing the price of one of the practical components will result in two mixes of the three LPG products: 1.The content of propylene in the LPG for cars will be minimal; 2.The propylene content in the automotive LPG will be maximum (max 12% according to the specification in table II). Case 1 assumes that the sale of propylene as a separate product without additi in a maximum profit. In tables III to V, are presented the simulation results in the RPMS of Case 1, starting from the data in tables I and II. Depending on the market demand and the season, the price of liquefied petroleum gas may vary. In the absence of logistical and production limitations, the refinery will maximize production of one of three types of LPG Depending on the market demand and the season, the price of liquefied petroleum gas may vary. In the ab of logistical and production limitations, the refinery will maximize production of one of three types of LPG products at the expense of other types to maximize the profit. In the following, it will be analyzed situations in which the price of one of the types of LPG products changes from one another, thus influencing the decision to add propylene to the LPG auto in order to optimize LPG mixtures. Changing the price of one of the practical components will result in two mixes of the three LPG mixtures. Changing the price of one of the practical components will result in two mixes of the three LPG the types of LPG products changes from one another, thus influencing the decision to add propylene to the LPG auto in order to optimize LPG The content of propylene in the LPG for cars will be minimal; The propylene content in the automotive LPG will be maximum (max 12% according to the specification in The propylene content in the automotive LPG will be maximum (max 12% according to the specification in Case 1 assumes that the sale of propylene as a separate product without additive in the LPG for cars will result in a maximum profit. In tables III to V, are presented the simulation results in the RPMS of Case 1, starting in a maximum profit. In tables III to V, are presented the simulation results in the RPMS of Case 1, starting ve in the LPG for cars will result @ IJTSRD | Available Online @ www.ijtsrd.com www.ijtsrd.com | Volume – 3 | Issue – 1 | Nov-Dec 2018 Dec 2018 Page: 1096
International Journal of Trend in Scientific Research and Development (IJTSRD) ISSN: 2456 International Journal of Trend in Scientific Research and Development (IJTSRD) ISSN: 2456 International Journal of Trend in Scientific Research and Development (IJTSRD) ISSN: 2456-6470 TABLE III Production of LPG for cars production (case 1) TABLE III Production of LPG for cars production (case 1) Properties, %gr C3 C4 96% 2% 97% 2% 40% 58% 3% 95% 3367 5798 0,73% 36% 62% 1,27% 2,47% Flow Consumption, Consumption, t C2 2% 1% 1% 0% 68 C5 0% 0% 1% 2% 119 C3’ 4% 96% 0% 2% 231 2,47% Propane Propylene Propane-butane Butane Total, t Total, %gr 3000 0 800 5552 9352 TABLE IV Product TABLE IV Production of LPG type 3 (case 1) Properties, %gr C3 C4 96% 2% 97% 2% 40% 58% 1% 3% 95% 2% 199 6316 133 133 3% 95% 2% Flow Consumption, t Consumption, t C2 2% 1% 1% 0% 0 0,00% C5 0% 0% 96% C3’ 4% 4% 96% 0% 2% 133 2% C3’ Propane Propylene Propane-butane Butane Total, t Total, %gr 0 0 0 0% 2% 6648 6648 2% TABLE V Production of propylene (case 1) TABLE V Production of propylene (case 1) Properties, %gr C3 C4 96% 2% 0% 97% 2% 0% 96% 40% 58% 1% 3% 95% 2% 3880 80 1,00% 97% 2% Flow Consumption, t Consumption, t C2 2% 1% 1% 0% 40 C5 C3’ 4% 4% 96% 0% 2% 3840 96% C3’ Propane Propylene Propane-butane Butane Total, t Total, %gr 0 4000 0 0 4000 0% 2% 3840 0 0% 96% Case 2 assumes that the addition of propylene in the LPG for cars will reduce the amount of LPG type 3 and propylene put up for sale and increase LPG production and get a maximum profit. In tables VI to VIII, are presented the simulation results in the RPMS of Case 1, starting from the data in tables I and II. TABLE VI Production of LPG for cars production (case 2) TABLE VI Production of LPG for cars production (case 2) Case 2 assumes that the addition of propylene in the LPG for cars will reduce the amount of LPG type 3 and propylene put up for sale and increase LPG production and get a maximum profit. In tables VI to VIII, are presented the simulation results in the RPMS of Case 1, starting from the data in tables I and II. presented the simulation results in the RPMS of Case 1, starting from the data in tables I and II. Case 2 assumes that the addition of propylene in the LPG for cars will reduce the amount of LPG type 3 and propylene put up for sale and increase LPG production and get a maximum profit. In tables VI to VIII, are Properties, %gr C3 C4 96% 2% 97% 2% 40% 58% 3% 95% 4761 8213 0,62% 36% 62,10% 1,28% Flow Consumption, t Consumption, t C2 2% 1% 1% 0% 82 C5 0% 0% 1% 2% 169 C3’ 4% 96% 0% 2% 1587 12% Propane Propylene Propane-butane Butane Total, t Total, %gr 3000 1360 800 8065 13225 TABLE VII Production of LPG type 3 (case 2) TABLE VII Production of LPG type 3 (case 2) Properties, %gr C3 C4 2% 96% 1% 97% 1% 40% 58% 1% 0% 3% 0 124 3928 83 0% 3% Flow Consumption, t C2 C5 0% 0% 96% C3’ 4% 4% 96% 0% 2% 83 2% C3’ Propane Propylene Propane-butane Butane Total, t Total, %gr 0 0 0 2% 2% 0% 2% 83 2% 4135 4135 95% 2% 95% 2% @ IJTSRD | Available Online @ www.ijtsrd.com www.ijtsrd.com | Volume – 3 | Issue – 1 | Nov-Dec 2018 Dec 2018 Page: 1097
International Journal of Trend in Scientific Research and Development (IJTSRD) ISSN: 2456 International Journal of Trend in Scientific Research and Development (IJTSRD) ISSN: 2456 International Journal of Trend in Scientific Research and Development (IJTSRD) ISSN: 2456-6470 TABLE VIII Production of propylene (case 2) TABLE VIII Production of propylene (case 2) Properties, %gr C3 C4 2% 96% 1% 97% 1% 40% 58% 1% 0% 3% 26 2561 1% 97% Flow Consumption, t C2 C5 C3’ 4% 4% 96% 0% 2% 2534 96% C3’ Propane Propylene Propane-butane Butane Total, t Total, %gr 0 2% 0% 2% 0% 96% 2640 0 0 2640 0% 2% 2534 95% 2% 53 2% 0% 96% 0 We can see how the production of LPG more LPG for cars, 2514 tons less LPG type 3 and 1360 tons less propylene. This difference in production of LPG products will underpin the economic analysis of the influence of LPG pri decision in the automotive LPG (tables IX and propylene are $ 420 / t, $ 320 / t and $ 600 / t, respectively. TABLE IX Influence of price change for propylen Propylene price,$/t 585 590 595 600 601 602 603 604 605 606 607 608 609 610 615 620 8535 assortments changes in both cases. Therefore, in case 2 were 3874 tons assortments changes in both cases. Therefore, in case 2 were 3874 tons more LPG for cars, 2514 tons less LPG type 3 and 1360 tons less propylene. This difference in production of more LPG for cars, 2514 tons less LPG type 3 and 1360 tons less propylene. This difference in production of LPG products will underpin the economic analysis of the influence of LPG prices on the propylene addition decision in the automotive LPG (tables IX-XI and figures 2-4). The standard price of LPG for cars, LPG type 3 and propylene are $ 420 / t, $ 320 / t and $ 600 / t, respectively. ces on the propylene addition 4). The standard price of LPG for cars, LPG type 3 Influence of price change for propylene on the decision to add propylene to Propylene price,$/t min C3', 103 $ max C3', 103 $ +/-, 103 8395 8415 8435 8455 8459 8463 8467 8471 8475 8479 8483 8487 8491 8495 8515 e on the decision to add propylene to LPG for cars $ 8422 8435 8449 8462 8464 8467 8470 8472 8475 8478 8480 8483 8486 8488 8501 8515 27 20 13 7 5 4 3 1 0 -2 -3 -4 -6 -7 -14 -21 @ IJTSRD | Available Online @ www.ijtsrd.com www.ijtsrd.com | Volume – 3 | Issue – 1 | Nov-Dec 2018 Dec 2018 Page: 1098
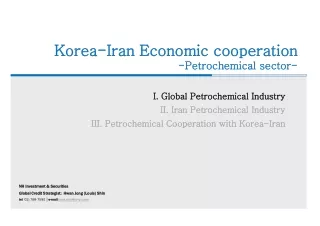
International Journal of Trend in Scientific Research and Development (IJTSRD) ISSN: 2456 International Journal of Trend in Scientific Research and Development (IJTSRD) ISSN: 2456 International Journal of Trend in Scientific Research and Development (IJTSRD) ISSN: 2456-6470 Fig.2 Influence of price change for propylene on the decision to add propylene to Fig.2 Influence of price change for propylene on the decision to add propylene to Fig.2 Influence of price change for propylene on the decision to add propylene to LPG for cars able IX and fig.2 it shows that in the case of a propylene price below 605 $ / t, the optimal decision will be to maximize the addition of propylene in the LPG for cars for maximum profit. Above 605 $ / t By analyzing table IX and fig.2 it shows that in the case of a propylene price below 605 $ / t, the optimal decision will be to maximize the addition of propylene in the LPG for cars for maximum profit. Above 605 $ / t it is recommended to minimize propylene in the LPG TABLE X Influence of price change for LPG type 3 on the decision to add propylene to LPG for cars Propylene price,$/t 310 315 320 321 322 323 324 325 330 335 8555 able IX and fig.2 it shows that in the case of a propylene price below 605 $ / t, the optimal decision will be to maximize the addition of propylene in the LPG for cars for maximum profit. Above 605 $ / t it is recommended to minimize propylene in the LPG for cars. Influence of price change for LPG type 3 on the decision to add propylene to LPG for cars Influence of price change for LPG type 3 on the decision to add propylene to LPG for cars Propylene price,$/t min C3', 103 $ max C3', 103 $ +/-, 103 8389 8422 8455 8462 8468 8475 8482 8488 8522 $ 8420 8441 8462 8466 8470 8474 8478 8482 8503 8524 32 19 7 4 2 -1 -3 -6 -19 -31 @ IJTSRD | Available Online @ www.ijtsrd.com www.ijtsrd.com | Volume – 3 | Issue – 1 | Nov-Dec 2018 Dec 2018 Page: 1099
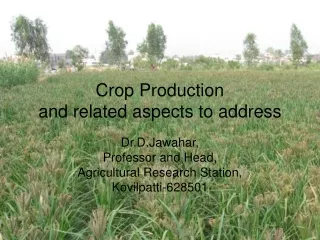
International Journal of Trend in Scientific Research and Development (IJTSRD) ISSN: 2456 International Journal of Trend in Scientific Research and Development (IJTSRD) ISSN: 2456 International Journal of Trend in Scientific Research and Development (IJTSRD) ISSN: 2456-6470 Fig.3 Influence of price change for LPG type 3 on the decision to add propylene to LPG for cars Fig.3 Influence of price change for LPG type 3 on the decision to add propylene to LPG for cars Fig.3 Influence of price change for LPG type 3 on the decision to add propylene to LPG for cars Analyzing table X and fig. 3, it follows that in the case of a decision will be to maximize the addition of propylene in the LPG for cars to maximize the profit. TABLE XI Influence of price change for LPG for cars on the decision to add propylene Propylene price,$/t 405 410 415 416 417 418 419 420 425 430 Analyzing table X and fig. 3, it follows that in the case of a price of LPG type 3 below 323 $ / t, the optimal decision will be to maximize the addition of propylene in the LPG for cars to maximize the profit. decision will be to maximize the addition of propylene in the LPG for cars to maximize the profit. price of LPG type 3 below 323 $ / t, the optimal Influence of price change for LPG for cars on the decision to add propylene to LPG for cars Influence of price change for LPG for cars on the decision to add propylene lene price,$/t min C3', 103 $ max C3', 103 $ +/-, 103 8315 8362 8408 8418 8427 8436 8446 8455 8502 8549 $ 8263 8329 8396 8409 8422 8435 8449 8462 8528 8594 -52 -32 -13 -9 -5 -1 3 7 26 45 @ IJTSRD | Available Online @ www.ijtsrd.com www.ijtsrd.com | Volume – 3 | Issue – 1 | Nov-Dec 2018 Dec 2018 Page: 1100
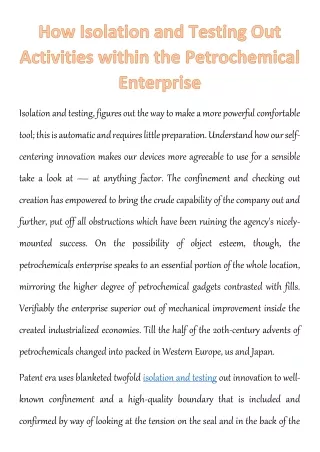
International Journal of Trend in Scientific Research and Development (IJTSRD) ISSN: 2456 International Journal of Trend in Scientific Research and Development (IJTSRD) ISSN: 2456 International Journal of Trend in Scientific Research and Development (IJTSRD) ISSN: 2456-6470 Fig.4 Influence of price change for LPG for cars on the decision to add propylene e of price change for LPG for cars on the decision to add propylene e of price change for LPG for cars on the decision to add propylene to LPG for cars Analyzing table XI and fig. 4, it follows that in the case of a LPG price lower than $ 418 / t, the optimal decision will be to minimize the addition of propylene in the L it is recommended to maximize propylene in the LPG for cars. IV. Conclusions In order to find out the optimal solution in a production matter, regarding the refining and petrochemical industry, there is useful to identify proper software that could assist the manager. Therefore this paper has exemplified the capabilities of RPMS (Refinery and Petrochemical Modeling System) software. The case study refers to optimizing LPG blends within a refinery. It was de taking in account different scenarios, the decision points in order to maximize the profit. References 1.J. A. Lawrence, B. A. Pasternack, Applied Management Science: Modeling, Spreadsheet Analysis, and Communication for decision Making, John Wiley&Sons, Inc. 2002, pp.5 Analyzing table XI and fig. 4, it follows that in the case of a LPG price lower than $ 418 / t, the optimal Analyzing table XI and fig. 4, it follows that in the case of a LPG price lower than $ 418 / t, the optimal decision will be to minimize the addition of propylene in the LPG for cars for maximum profit. Above 418 $ / t it is recommended to maximize propylene in the LPG for cars. PG for cars for maximum profit. Above 418 $ / t 2.https://support.office.com/en and-solve-a-problem-by-using 079d-43ac-a7eb-f63e45925040 https://support.office.com/en-us/article/define- In order to find out the optimal solution in a production matter, regarding the refining and using-solver-5d1a388f- f63e45925040 eful to identify 3.http://www.fico.com/en/products/fico optimization#overview. http://www.fico.com/en/products/fico-xpress- proper software that could assist the manager. Therefore this paper has exemplified the capabilities (Refinery and Petrochemical Modeling software. The case study refers to optimizing LPG blends within a refinery. It was determined, taking in account different scenarios, the decision 4. https://www.honeywellprocess.com/en US/explore/products/advanced software-production- management/Pages/rpms.aspx. management/Pages/rpms.aspx. https://www.honeywellprocess.com/en- /explore/products/advanced-applications/ 5.E. Severin, Prezentare Planificarea producției, baza de date PETRO Ploiești, 2016. Planificarea optimizată a , baza de date PETRO-LUK S.A., J. A. Lawrence, B. A. Pasternack, Applied Management Science: Modeling, Spreadsheet Analysis, and Communication for decision y&Sons, Inc. 2002, pp.5-27. 6.L.L.Lapin, W.D.Whistler, Quantitative decision making with spreadsheet applications, Thomson Learning, Belmont, USA, 2002, pp.325 Learning, Belmont, USA, 2002, pp.325-329. L.L.Lapin, W.D.Whistler, Quantitative decision making with spreadsheet applications, Thomson @ IJTSRD | Available Online @ www.ijtsrd.com www.ijtsrd.com | Volume – 3 | Issue – 1 | Nov-Dec 2018 Dec 2018 Page: 1101