Download
1 / 18
180 likes | 223 Views
For more details visit: https://www.bharatpetroleum.com/

E N D
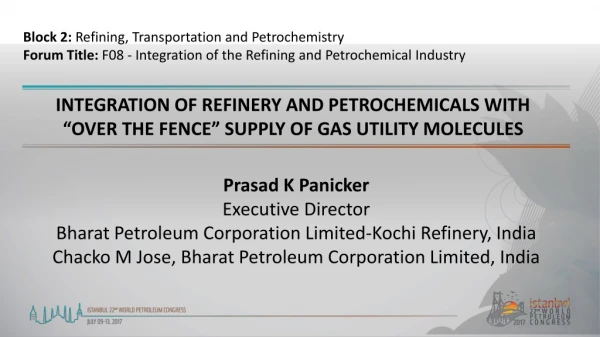
Block 2: Refining, Transportation and Petrochemistry Forum Title: F08 - Integration of the Refining and Petrochemical Industry INTEGRATION OF REFINERY AND PETROCHEMICALS WITH “OVER THE FENCE” SUPPLY OF GAS UTILITY MOLECULES Prasad K Panicker Executive Director Bharat Petroleum Corporation Limited-Kochi Refinery, India Chacko M Jose, Bharat Petroleum Corporation Limited, India
BHARAT PETROLEUM CORPORATION LIMITED - KOCHI REFINERY BPCL – 13% share in refining capacity of India. Kochi Refinery is one among the four Refineries Refinery is located in Kochi, the port city on the south-west coast of India, also known as Queen of Arabian Sea India - 0.23 Billion Crude oil processing capacity and Crude oil import of 70 Billion USD • Capacity of 190,000 BPSD • Complexity of 6.3 • Crude API of 38.7 & 0.65 wt% Sulfur •Fourth Quartile •Third Quartile Refining Energy Intensity Index Benchmark with World class Performance (Solomon Associate 2014 Analysis) Net Cash Margin • Energy Intensity Index of 105.2 • Specific Green house Gas emission of 0.179 Kochi Refinery today Environment Process Unit Utilization Operational Availability •Second Quartile •Second Quartile • Refining Margin of 6.0 $/bbl, against Singapore Cracking margin of 7.5 • 4.6 $/bbl lower than USGC coking margin Value Maximization Source : PPAC
THE NEED FOR AIMING HIGH.. 310 Oil Consumption Per capita, bbls In MMT Light Distillates 5.7% 22.1 88 190 65 7.7 Middle Distillates 7.6 7.5 7.5 7.4 6.6 6.5 6.5 6.5 6.4 114 6.2 6.1 5.9 5.7 82 5.6 Heavy Distillates Present Expanding to 5 30 22 2.7 FY15 FY21 1 Market study suggested 120,000 BPSD capacity expansion USA China India World Avg FY 15 FY 16 FY 17 FY 18 FY 19 Growth of Petroleum products EIU GDP IMF GDP Inflation Indian Oil demand to grow more Indian Economy shifting to a higher growth path Source : ENI annual World Oil and Gas review, PPAC
THE TRIGGERS.. Accelerated Global demand for fuels Changes in Marine Fuel sulfur specifications Growing market demand for Petrochemicals in India 90 Percapita Polymer consumption, Kilogram Indian Petrochemicals demand increased by 7 % CAGR over 2011-16 vis-à-vis GDP of 5.5%. 46 35 Value increased from 1.63 Billion USD in 2007-08 to 8.25 Billion USD in 2015-16 . of Net import of petrochemicals 8 USA China India World Avg Source : MoPNG-working group
WHY KOCHI REFINERY.. Land availability Close to international maritime route and port infrastructure Single Point Mooring facility, which can support up to 15.5 MMTPA Excellent product evacuation facilities Higher demand of products in Southern region of India Natural Gas availability
FINDING A PERFECT CONFIGURATION.. Making a Product portfolio that meets market demand with maximum value addition Full Conversion Hydrocracker. Once-through Hydrocracker with High Conversion FCCU. Conventional FCCU with downstream treatments. Secondary Processing Options Secondary Processing Options Configuration Study Slurry Hydrocracker. Delayed Coker. Flexi-coking. Solvent De-asphalting. Flexibility to optimize between Transportation fuels and Petrochemical feedstock Residue Upgradation Options Optimum Hydrogen addition and Carbon rejection technology Key Areas Delayed Coker Unit, ranked second on margins, selected for residue up-gradation. Slurry Hydrocracker was not preferred, i. high capital cost ii. expected difficulties in operation including disposal of pitch Diversification of value added petrochemicals gave edge to Once-through Hydrocracker with High Conversion FCCU. Conversion of bottom of the barrel to Value added products Final Selection
HIGHLIGHTS OF THE PROJECT.. Capacity Expansion from 1,90,000 bbl/day to 3,10,000 bbl/day (15.5 MMTPA). Meeting Auto Fuel compliant to 100% BS-IV and part BS-VI grade. Flexibility to process crude oils with 30 – 38 API. Facility for bottom up gradation and diversification to Petrochemicals. Production of 0.5 MMT of propylene and 1.3 MMT of Petcoke. Hydrogen demand is 16.4 TPH & Syngas requirement for Petrochemical plant is 14 TPH. Capital cost of 3 billion USD for Refinery expansion, 700 million USD for Petrochemical plant & 400 million for Utility gas molecule complex.
PROPYLENE DERIVATIVE PETROCHEMICAL PROJECT (PDPP).. Entry of BPCL into the field of Propylene based Petrochemicals. PDPP taken up as a BPCL Project, a ‘Make in India’ initiative as envisaged niche petrochemicals are pre- dominantly imported. Production of Niche Petrochemicals utilizing 250 TMT out of 500 TMT of Polymer grade Propylene available post IREP. Acrylic Acid Acrylates : Butyl Acrylate, 2 Ethyl Hexyl Acrylate Oxo Alcohols : Normal Iso Butanol Total project cost : 700 Million USD. Butanol, 2 Ethyl Hexanol,
PDPP - INTEGRATION WITH REFINERY.. Technology selection was done with the objective of maximizing the net present value from the entire life cycle of the unit. Syngas, Hydrogen and Nitrogen to be sourced from Build-Own Operate (BOO) facilities being installed as part of IREP. Loading of products using Refinery facilities Sourcing Feedstock & Utilities For Firewater system integration Capex/Opex Advantage Location Advantage: Nearer to Refinery Effluent treatment in Refinery facilities Refinery
‘OVER THE FENCE’ GAS UTILITY SUPPLY.. The operational synergy between IREP & PDPP made sense to outsource Industrial Gases required for both. The selection of Build-Own Demand (BOO) would minimize the capital required for IREP & PDPP. Highly energy efficient unit design with GT integrated with H2 Plant Pricing of Hydrogen, Syngas & Steam depends on operating efficiency at varying capacities. Pricing model arrived was each product from BOO shall attract a Fixed monthly charge and Variable Charge based on actual consumption. The Variable Charge calculation was based on 12 windows of operation. Utility supplier for Future Projects Flexibility to operate on NG or Naphtha BOO at BPCL- Kochi Refinery Power required is generated by BOO operator with backup supply from Refinery ‘Buy & Sell’ or Tolling model pricing philosophy
TRANSFORMATION TO A WORLD CLASS GREEN REFINERY.. Routine expansion project in a growing economy has been turned into well thought out plan for efficiency improvement, value addition, risk reduction and transformation as a modern industrial complex with World Standards. World best Refinery Characteristics (Solomon Associates 2014) Kochi Refinery Post Expansion 105.2 EII 90.0 11.0 6.0 15.2 Crude Capacity - 380 Kbbl/day 5.0 310 Complexity – 13.3 10.3 Crude oil API – 31.9, Sulfur – 1.6 wt% 15.5 6.0 30.6, 2.6 9.5 Total conversion – 52% 48
HIGHLIGHTS OF THE PROJECT – UNIT CAPACITIES & PRODUCT PATTERN.. Process Units Present Capacity, MMTPA Additional Capacity, MMTPA Product Pre-expansion, TMT/Anm Post expansion, TMT/Anm Propylene Gasoline LPG SKO HSD ATF Naphtha Bitumen FO/ LSHS Sulphur Petcoke 50 480 1115 360 4384 400 392 250 1400 33 0 540 1109 2209 240 8112 600 451 250 0 303 1337 CDU/VDU 5 + 4.5 10.5 DHDT 2.54 4.3 VGO HDT 1.7 3.0 FCCU 1.45 2.2 NHT/Isom (Revamp) 0.37 DCU 3.8 HGU 18,000 TPA 130,000 TPA SRU 3 X 72 TPD 2 X 340 TPD
HIGHLIGHTS OF THE PROJECT – PROJECT ENORMITY.. Item Description Piling Structural Erection Above ground Piping Work Equipment erection Quantity 21,000 Numbers 60,000 MT 7,300,000 Inch Meter 2062 Numbers / 41,000 MT (250+ Over Dimensional Consignments) Electrical/Instrument cable laying 7,000 Km
ENERGY EFFICIENCY DRIVERS & ENVIRONMENT FRIENDLY CONCEPTS.. Hot Water Belt(HWB) system at Petro-FCCU. Total heat recovered will be 84.3 MMKCal/hr. Power Recovery Expander (PRE) at Petro-FCCU PRE receives flue gas from Regenerator and produce 11 MW of power. Considering this, PFCCU is a net-exporter of power. Electrostatic Precipitator at Petro-FCCU. Ensures Suspended Particulate Matter in the flue gas is less than 50 mg/NM3 Back Pressure Turbines with VHP steam. Sulfur Recovery Units with Tail Gas Treaters ensure 99.9% sulfur removal and emissions well below the norms of 1518 Kg/hr. Coke handling system in DCU. Reverse Osmosis based De-mineralized water plant.
PDPP - PROCESS FLOW.. All figures in ‘000 TPA Sales 47 (50) CRUDE ACRYLIC ACID (160) (160) (113) GLACIAL ACRYLIC ACID (Future) PROPYLENE (110) (250) SAP 0 (Future) OXO ALCOHOL (212) (106) 180 BUTYL ACRYLATE N-BUTANOL (150) (110) 38 (4) (137) 2-ETHYL HEXANOL (55) 2-ETHYL HEXYL ACRYLATE (99.8) 10 SYN GAS (8) (6.5) 47 I-BUTANOL (7) HYDROGEN 7
‘OVER THE FENCE’ GAS UTILITY SUPPLY - PRICING.. 100% Variable charges / Ton of Hydrogen with Natural Gas as Feed/fuel. 3 1 2 C1,C2,C3,C4 D1,D2,D3,D4 C1*,C2*,C3*,C4*,C5 D1*,D2*,D3*,D4*,D5 C1,C2,C3,C4 D1,D2,D3,D4 C1*,C2*,C3*,C4*,C5 D1*,D2*,D3*,D4*,D5 12 C1,C2,C3,C4 D1,D2,D3,D4 C1*,C2*,C3*,C4*,C5 D1*,D2*,D3*,D4*,D5 C1, C2, C3, C4 C1*, C2*, C3*, C4*, C5 Scenario – 1 :With Power from CPP of BOO Operator 70% C1*NG1+C2*DM1+C3*RW1-(C4*ST1) 4 5 6 C1,C2,C3,C4 D1,D2,D3,D4 C1*,C2*,C3*,C4*,C5 D1*,D2*,D3*,D4*,D5 C1,C2,C3,C4 D1,D2,D3,D4 C1*,C2*,C3*,C4*,C5 D1*,D2*,D3*,D4*,D5 C1,C2,C3,C4 D1,D2,D3,D4 C1*,C2*,C3*,C4*,C5 D1*,D2*,D3*,D4*,D5 Scenario – 2: With Power from BPCL/Other sources 11 C1, C2, C3, C4 C1*, C2*, C3*, C4*, C5 C1**NG1+C2**DM1+C3**RW1-(C4**ST1) +C5*P1 50% Hydrogen Capacity 7 8 9 For Syngas, all “D” factors quoted by the BOO Operator as per the table will be used for the above two scenarios. 10 C1,C2,C3,C4 D1,D2,D3,D4 C1*,C2*,C3*,C4*,C5 D1*,D2*,D3*,D4*,D5 C1,C2,C3,C4 D1,D2,D3,D4 C1*,C2*,C3*,C4*,C5 D1*,D2*,D3*,D4*,D5 C1,C2,C3,C4 D1,D2,D3,D4 C1*,C2*,C3*,C4*,C5 D1*,D2*,D3*,D4*,D5 C1, C2, C3, C4 C1*, C2*, C3*, C4*, C5 35% 35% 50% 70% 100% Syn Gas Capacity
TRANSFORMATION OF SOCIETY ALONG WITH REFINERY GROWTH.. • Workmen from length & breadth of the nation have received employment opportunities. Employment Opportunities Gain for Cochin Port • Increased traffic and revenue for Cochin Port. Further foray into Niche/Specialty Petrochemicals • Potential for major Petrochemical plants in the area & resultant employment generation. Petrochemical Park • For medium and small scale industries. • Portion of Project expenditure is earmarked for developing nearby community. Community Development