Download
1 / 37
370 likes | 552 Views
The Production Decisions of Competitive Firms. Alternative market structures: perfect competition monopolistic competition oligopoly monopoly. Crucial elements in distinguishing between alternative market structures:. The number of buyers and sellers. The degree of product homogeneity.

E N D
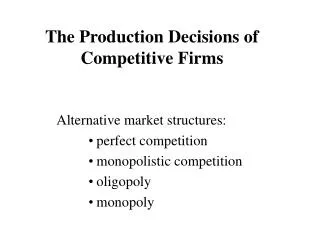
The Production Decisions of Competitive Firms Alternative market structures: • perfect competition • monopolistic competition • oligopoly • monopoly
Crucial elements in distinguishing between alternative market structures: • The number of buyers and sellers. • The degree of product homogeneity. • Knowledge of market prices and product availability. • Firms’ ease of entry into, and exit from, the industry.
Attributes of a market in which there is perfect competition: 1. There are large numbers of buyers and sellers. 2. The product is homogeneous; buyers view the units sold by all sellers as being perfect substitutes (functionally identical). 3. There is freedom of entry and exit by firms. 4. There is complete information regarding prices, technology and profit opportunities. 5. The objective of each firm is to maximize its profits.
Each competitive firm is a price taker in that it will take the price as being given. Explanation: If a firm tries to charge a higher price, buyers will go to other sellers who they know are willing to sell the same product. A firm could sell at a lower price. However, since it can sell all units at the market price, it will not do so, since the result would be lower profits.
Relationship between a firm’s demand curve and the market P individual firm P Market S P0 P0 d D Q q 50,000 100 200 A price-taking firm faces a horizontal demand curve.
Total Revenue, TR, is the money receipts generated from a given level of output, Q. Example: Suppose a firm sells 100 units at $20 each and 50 units at $10 each. Total revenue would equal $2,500. $2,500 = $20 • 100 + $10 • 50 Special case: When a firm sells all units of output, Q, at the same price, P, total revenue will be TR = P • Q.
Average Revenue, AR, is the revenue per unit of output; When all units are sold at the same price, AR = P.
Marginal Revenue, MR, is the change intotal revenue per unit of change in output; When all units are sold at the same price, MR = P.
In summary, when a firm is a price-taker, P = MR = AR. The above relationships are illustrated in the following example:
Choices faced by a firm: Short-run decisions: • quantity of output • quantity of each variable input • shutdown decision Long-run decisions: • quantity of output • quantity of each and every input • entry and exit decision What about the choice of price?
Consider a perfectly competitive firm operating in a market where the equilibrium price is $13. Given the cost structure shown, what level of output will the firm choose?
Consider a perfectly competitive firm operating in a market where the equilibrium price is $13. Given the cost structure shown, what level of output will the profit maximizing firm choose? Profits are largest at 5 units of output.
The profit maximizing level of output can be inferred using marginal analysis.For the units of Q up to the 5th, MR > MC.Beyond the fifth unit, MR < MC.
Suppose the cost structure is unchanged but the market price is $10.
Case of the market price equaling $10. With P = $10, MC equals MR when output is 4 units. Check whether an output of 4 units maximizes profits.
Case of the market price equaling $10. Note: At the optimal level of output (Q = 4), profits are negative. Why doesn’t the firm shut down, i.e., produce no output? The loss is smaller (profits are larger) if the firm produces 4 units.
The firm would make larger profits (here have a smaller loss) by shutting down and not producing any output.
Measuring Profits and Costs Graphically P = $2.00 2.50 MC 2.00 ATC 1.50 1.30 1.00 AVC .50 40 50 20 30 10 Q = 50
Measuring Profits and Costs Graphically P = $2.00 2.50 MC 2.00 $35 ATC 1.50 1.30 $15 1.00 AVC .50 40 50 20 30 10 Q = 50
Measuring Profits and Costs Graphically (P=$1.00) P MC 2.50 2.00 AC 1.50 P = $1.00 1.20 1.00 AVC 0.70 .50 Q 40 50 20 30 10
Measuring Profits and Costs Graphically P MC 2.50 2.00 AC 1.50 P = $1.00 1.20 1.00 AVC 0.70 .50 Q 40 50 20 30 10
Condition for profit maximization in the short-run: A firm will produce the level of output where MR = MC as long as it is not more profitable for the firm to shut down (i.e., not produce any output). Short-run profits if the firm shuts down: Π0 = TR - TC = (TR - VC) - FC = (0 - 0) - FC = - FC Short-run profits if the firm produces: Π1 = TR - TC = (TR - VC) - FC = (Q ·P - Q ·AVC) - FC = Q · (P - AVC) - FC
Shut-down Condition: It will be more profitable for the firm to produce in the short-run (rather than shut down) only if Π1 > Π0 or, equivalently, TR > VC. When all units are sold at the same price, an equivalent expressions is P > AVC. Conversely, it will be more profitable for the firm to shut down (rather than produce) if TR < VC or, equivalently, P < AVC.
$ per unit MC P1 P2 AVC P4 P5 q q4 q5 q1 q2
Restatement of profit maximizing firm’s short-run output decision rule: A firm will choose to shut down if P is less than the minimum AVC. Otherwise, the firm will produce the output for which the associated marginal cost is equal to marginal revenue, which equals price for a competitive firm.
Basic insights: • Fixed costs are irrelevant in the short-run shutdown decision, as well as in the decision of how many units to produce. 2. A firm’s MC curve above AVC is its short-run supply curve.
S $ per unit MC P1 P2 AVC P4 P5 q q4 q5 q1 q2
$ per unit MC P1 AC P2 P3 AVC P4 P5 AFC q q4 q5 q3 q1 q2
Choices faced by a firm: Short-run decisions: • quantity of output • quantity of each variable input • shutdown decision Long-run decisions: • quantity of output • quantity of each and every input • entry and exit decision
Attributes of a market in which there is perfect competition: 1. There are large numbers of buyers and sellers. 2. The product is homogeneous; buyers view the units sold by all sellers as being perfect substitutes (functionally identical). 3. There is freedom of entry and exit by firms. 4. There is complete information regarding prices, technology and profit opportunities. 5. The objective of each firm is to maximize its profits.
p MC AC P0 q0 q Profit Maximization in the Long-run • A firm will choose to produce the level of output where the long-run marginal cost of that output equals the market price; the level of output will be such that LRMC = P, provided that profits are not negative. • Entry-Exit Decision: • If profits are positive, other firms will enter the market. • If profits are negative, a firm will exit the market.
S1 D Sa S2 p p MC Sb AC P0 P0 p1 p1 P2 P2 P5 P1 q5 q0 q Q0 Q5 Q Suppose that all firms have an identical (long-run) cost structure as shown in figure 1. Demand is shown by D in figure 2. Market supply is initially Sa which reflects a given number of firms currently in the industry. Figure 1 Figure 2
Figure 1 Figure 2 D p p MC AC q Sb Q P5 P1 q5 Q5 An equilibrium exists when economic forces are in balance so that the values of economics variables have no tendency to change. Conditions for a competitive market to be in long-run equilibrium: 1. Each firm produces the level of output where the MC of the last unit produced equals the market price; P = MC. 2. Each firm earns zero economic profits (the level of output is such that P = AC).
D2 Sa p p MC AC D1 Sb P2 P2 SLR P1 P1 q q2 q1 Q1 Q2 Q3 Q The market long-run supply curve shows the relation between price and total quantity supplied for the case where the market is in long-run equilibrium. To construct the L-R supply curve, we hypothesize shifts in demand and see how long-run equilibrium price and quantity adjust. If changes in industry output do not result in changes in input prices, the long-run market supply curve will be horizontal (perfectly elastic).
D2 SSR P2 Q2 D1 Because firms can enter and exit in the long-run, the long-run supply curve typically is more elastic than the short-run supply curve. P1 SLR Q1 Q3
Reasons why the long-run supply curve might slope upward: • Firms may have different costs. • Some resources used in production may be limited in supply.
MC’ D2 AC’ MC Sa p p Sc AC D1 P2 P2 P4 P4 P1 P1 q Q1 Q2 Q4 Q Q3