Download
1 / 6
60 likes | 119 Views
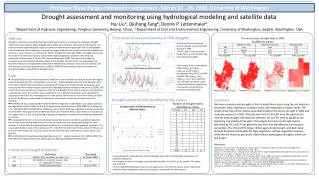
Drought is one of the extreme climatic events among the most relevant natural disasters. This paper presents drought assessment using Standardized Precipitation Index SPI to overview the respective drought hot spots. Monthly rainfall data during the previous 36 years 1982 2017 are applied to generate Standardized Precipitation Index SPI with 3 month and 9 month scale on the basis of Gamma distribution for the areas in the central dry zone of Myanmar namely Mandalay, Nyaung U, Myingyan, Natogyi, Meikhtila, Kyaukpadaung, Wundwin, Sagaing, Monywa, Shwebo, Myinmu, Magway, Minbu, Chauk and Pakokku. The generated SPI values for different time scale are classified to assess drought hot spots for the central dry zone, Myanmar as an areal extent of annual drought. Aye Aye Thant "Drought Assessment Using Standard Precipitation Index" Published in International Journal of Trend in Scientific Research and Development (ijtsrd), ISSN: 2456-6470, Volume-2 | Issue-5 , August 2018, URL: https://www.ijtsrd.com/papers/ijtsrd18181.pdf Paper URL: http://www.ijtsrd.com/engineering/civil-engineering/18181/drought-assessment-using-standard-precipitation-index/aye-aye-thant<br>

E N D
International Journal of Trend in Scientific Research and Development (IJTSRD) International Open Access Journal ISSN No: 2456 - 6470 | www.ijtsrd.com | Volume - 2 | Issue – 5 Drought Assessment Using Standard Precipitation Index Aye Aye Thant Lecturer, Department of Civil Engineering, Mandalay Technological University, Patheingyi, Mandalay, Myanmar ABSTRACT Drought is one of the extreme climatic events among the most relevant natural disasters. This paper presents drought assessment using Standardized Precipitation Index (SPI) to overview the respective drought hot spots. Monthly rainfall data during the previous 36 years (1982 – 2017) are applied to generate Standardized Precipitation Index (SPI) with 3-month and 9-month scale on the basis of Gamma distribution for the areas in the central dry zone of Myanmar namely Mandalay, Nyaung-U, Myingyan, Natogyi, Meikhtila, Kyaukpadaung, Wundwin, Sagaing, Monywa, Shwebo, Myinmu, Magway, Minbu, Chauk and Pakokku. The generated SPI values for different time scale are classified to assess drought hot spots for the central dry zone, Myanmar as an areal extent of annual drought. Keywords: Monthly Rainfall, Standardized Precipitation Index (SPI), Drought Assessment. I. INTRODUCTION Global warming is likely to alter patterns of global air circulation and hydrologic cycle that will change global and regional rainfall regimes. The amount and timing of runoff and intensity of floods and droughts are directly affected by a change in the total amount, frequency and the intensity of rainfall. In addition, extreme climate events such as drought are expected to become more frequent and intense in the world [1]. Drought which is an extreme event, is a natural hazard related to a prolonged lack of rainfall that leads to a temporary decrease or deficit in natural water availability. Unlike other disasters such as floods, tornados, tropical cyclones, earthquakes or volcanic eruptions, drought is a slowly developing phenomenon as it propagates through the full hydrologic cycle and it often shows persistent consequences after its termination [2]. The central dry zone in Myanmar is one of the most climate sensitive and natural resources poor regions. The dry zone lies stretching across the southern part of Sagaing Region, the western and middle part of Mandalay Region and most parts of Magway Region. This zone represents about 10% of the country’s total land area and about 34% of the country’s total population live in this zone. The area of dry zone is characterized by low rainfall, intense heat and degraded soil conditions all of which affecting social and economic situations of the communities living in this region. According to the Annual Drought Reports (2010–2013) prepared by Drought Monitoring Centre of Department of Meteorology and Hydrology (DMH), central area of Myanmar is more vulnerable to drought as compared to other parts. Intense rainfall frequency and intensity in this zone are scarcely occurred and temperature rises mostly above 40°C. The annual rainfall in this dry zone is less than 750mm, while the national average rainfall is 2353mm. In most areas of this zone, economic damages caused by droughts are as greater as those caused by other natural disasters. Prolonged drought cycles are major factors in land degradation processes in this zone. The dangers of drought are liable to lead a major crisis in water resources and affect all sectors of society [3]. II. MATERIALS AND METHOD Monthly rainfall records for the period from 1982 to 2017 were collected from the Department of Meteorology and Hydrology for 15 selected stations in central dry zone of Myanmar namely Mandalay, Nyaung-U, Myingyan, Natogyi, Meikhtila, @ IJTSRD | Available Online @ www.ijtsrd.com | Volume – 2 | Issue – 5 | Jul-Aug 2018 Page: 1814
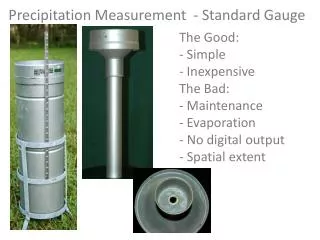
International Journal of Trend in Scientific Research and Development (IJTSRD) ISSN: 2456-6470 Kyaukpadaung, Shwebo, Myinmu, Magway, Minbu, Chauk and Pakokku. The SPI based on the Gamma distribution, developed by McKee, Doesken and Kleist (1993) has been generated using spi_sl_6.exe available in Windows/PC version Meteorological Organization, 2012. The SPI was based on the probability of rainfall for any timescale. The probability of observed rainfall was then transformed into an index. SPI describes the actual rainfall as a standardized departure with respect to rainfall probability distribution function and hence the index has gained importance in recent years as a potential drought indicator across different stations. In this paper, the SPI values have been generated for 3- month and 9-month timescales. A.Gamma Distribution Function Computing of SPI involves fitting a Gamma probability density function to a given frequency distribution of rainfall for a station. The SPI represents a Z-score used in statistics. Thom (1966) found the Gamma distribution to fit climatological precipitation time series well [6]. The Gamma distribution is defined by its frequency or probability density function: g(x) = Where α and β be the parameters of the Gamma probability density function which are estimated for each station and each timescale of interest the year. The maximum likelihood solutions are used to optimally estimate α and β: Wundwin, Sagaing, Monywa, Since the Gamma distribution function is undefined for x = 0 and the precipitation distribution may contain zeros, the cumulative probability becomes: H(x) = q + (1 – q) G(x) Where, q is the probability of a zero. The cumulative probability H(x) is then transformed to standard normal random variable Z with a mean zero and variance of one, which is the value of the SPI. For 0 < H(x) ≤ 0.5, Z = SPI = (t- For 0.5 < H(x) ≤ 1.0, Z = SPI = (t- Where, published by World c0 + c1t + c2t2 1+ d1t+ d2t2+ d3t3) c0 + c1t + c2t2 1+ d1t+ d2t2+ d3t3) 1 t = √ln( (H(x))2)for 0 < H(x) ≤ 0.5 1 t = √ln( (1 - H(x))2)for 0.5 < H(x) ≤ 1.0 c0= 2.515517 c1 = 0.802853 c2 = 0.010328 d1 = 1.432788 d2 = 0.189269 d3 = 0.001308 βα τ(α)xα - 1e-xβ 1 ⁄ B.Program of spi_sl_6.exe This application is a statistical monthly indicator during a period of n months with the long-term cumulated rainfall distribution for the same location and accumulation period. Rainfall is the only input parameter. Ideally, one needs at least 20-30 years of monthly values, with 50-60 years (or more) being optimal and preferred. The program can be run with missing data, but it will affect the confidence of the results, depending on the distribution of the missing data in relation to the length of the record. The application is a tool which was developed primarily for defining and monitoring drought but is not a drought prediction tool. Because of computer aid application, the input data is simply defined on Microsoft Notepad as “.cor”. This data is saved as MS_DOS ASCII text files. It can generate with multi- timescales in one calculation whereas output file must have “.dat” format. The results for one event has in same folder with spi_sl_6.exe.[4] Observed SPIs from the application can be plotted in Excel spreadsheet. C. SPI Timescales 4 A(1+ √1+ 4 A β =x 1 3) α = Where: Resulting parameters are then used to find the cumulative probability of an observed precipitation event for the given month and time scale for the station. Cumulative probability is given by: G(x) = ∫ g(x)dx 0 Letting t = "x" /"β" be the equation becomes complete function: G(x) = α A = ln(x) - ∑ln (x) n = number of rainfall observations n βατ(α)∫ xα - 1e- xβ 0 x x 1 ⁄ dx t 1 τ(α)∫ tα - 1et 0 dt @ IJTSRD | Available Online @ www.ijtsrd.com | Volume – 2 | Issue – 5 | Jul-Aug 2018 Page: 1815
International Journal of Trend in Scientific Research and Development (IJTSRD) ISSN: 2456-6470 The SPI was designed to quantify the rainfall deficit for multiple timescales: namely, 1-month, 3-month, 6- month, 9-month, 12-monht timescales. In this study, 3-month and 9-month timescales of SPI are generated and analyzed. The 3-month SPI provides a comparison of the rainfall over a specific 3-month period with the rainfall totals from the same 3-month period for all the years included in the historical record. A 3-month SPI reflects a short-term and medium-term moisture conditions and provides a seasonal estimation of precipitation. Because these periods are characterized by little rain, the corresponding historical totals will be small, and relatively small deviations on either side of the mean could result in large negative or positive SPIs [4, 5]. The 9-month SPI provides an indication of inter- seasonal precipitation patterns over a medium timescale duration. Drought usually takes a season or more to develop. SPI values below -1.5 for these timescales are usually a good indication that dryness is having a significant impact on agriculture and may be affecting other sectors as well. This time period begins to bridge a short-term seasonal drought to those longer-term droughts that may become hydrological or multi-year, in nature [4, 5]. D. Classification of Drought Event McKee and others (1993) used the classification system in the SPI value table (Table 1) to define drought intensities resulting from the SPI. They defined the criteria for a drought event for any of the timescales. A drought event occurs any time when the SPI is continuously negative and reaches at intensity of -1.0 or less. The event ends when the SPI becomes positive. Each drought event has a duration defined by its beginning and end, and the intensity for each month that the event continues [4]. The drought categories are classified based on SPI values as shown in Table 1. Table1. Drought Classification in SPI Values SPI Values Drought Category ≥ 2.0 Extremely wet 1.5 to 1.99 1.0 to 1.49 Moderately wet -0.99 to 0.99 -1.0 to -1.49 Moderately dry -1.5 to -1.99 < -2.0 III.Results and Discussion The results of cohesion soil are as follows.SPI for 3- month and 9-month timescales are generated adopting the methodology mentioned above, and drought categories are classified. Figures 1 through 12 are illustrations of SPI-3 and SPI-9 for some selected stations in central dry zone. Figure 13 and Figure 14 present drought occurrence in percentage for both SPI timescales for every station under study. It is evident from these figures that moderate droughts were occurred frequently in all stations. Extreme drought did not occur at Pakokku in SPI-3 time scale. But other stations experienced extreme drought for both timescales in 1983. The most extreme droughts were occurred in 1983 (May, June and December), 2004 (December) and 2005 (May) for 3-month timescale and 1983 (March, April, May and June), 2005 (June) for 9-month timescale, experienced droughts less than -2, including some regions facing very extreme drought with SPI values less than -3.1. The areas which experienced severe drought for both SPI timescales were observed as Mandalay, Nyaung-U, Myingyan, Kyaukpadaung, Sagaing, Monywa, Myinmu, Magway, Minbu and Pakokku. The extreme droughts less than -2.4 were found in Mandalay (December, 2004), Nyaung-U (August, 1998), Kyaukpadaung Magway (July, 1985) for SPI-3 timescale and Myingyan (July, 1983), Wundwin (June, 1993), Sagaing (November, 1994), Monywa (December, 1982) for SPI-9 timescale. Though, for SPI-9 time scale, less frequent extremely drought was found in Minbu and more moderate wet years were observed in Chauk. Figure 15 illustrates areal extent of annual droughts for both SPI timescales during 1982-2017. As for areal extent of annual drought in SPI-3 during 1982- 2017, only moderate drought was occurred at three stations (Nyaung-U, Monywa and Pakokku) in 1996, two stations (Monywa and Shwebo) in 2002, one station (Shwebo) in 2006, one station (Nyaung-U) in 2017 and, drought did not occur at any stations in 2011 among selected stations. As for areal extent of annual drought in SPI-9 during 1982-2017, only moderate drought was occurred at two stations (Myingyan and Magway) in 1984, three stations (Sagaing, Monywa and Shwebo) in 2002, two stations (Meikhtila and Wundwin) in 2003, four stations (Natogyi, Wundwin, Myinmu and Minbu) in 2004 and, drought did not occur at any stations in 2007, 2011, 2016 and 2017 among selected stations. up to 24-month where most regions (May, 2005), Very wet Near normal Severely dry Extremely dry @ IJTSRD | Available Online @ www.ijtsrd.com | Volume – 2 | Issue – 5 | Jul-Aug 2018 Page: 1816
International Journal of Trend in Scientific Research and Development (IJTSRD) ISSN: 2456-6470 Fig5. SPI-3 for Magway Fig1. SPI-3 for Mandalay Fig6. SPI-3 for Pakokku Fig2. SPI-3 for Nyaung-U Fig7. SPI-9 for Myingyan Fig 3.SPI-3 for Kyaukpadaung Fig4. SPI-3 for Myinmu Fig8. SPI-9 for Wundwin @ IJTSRD | Available Online @ www.ijtsrd.com | Volume – 2 | Issue – 5 | Jul-Aug 2018 Page: 1817
International Journal of Trend in Scientific Research and Development (IJTSRD) ISSN: 2456-6470 Fig9. SPI-9 for Sagaing Fig11. SPI-9 for Minbu Fig10. SPI-9 for Monywa Fig12. SPI-9 for Chauk Fig13. Percentage of Drought Occurrence in SPI-3 Fig14. Percentage of Drought Occurrence in SPI-9 @ IJTSRD | Available Online @ www.ijtsrd.com | Volume – 2 | Issue – 5 | Jul-Aug 2018 Page: 1818
International Journal of Trend in Scientific Research and Development (IJTSRD) ISSN: 2456-6470 Fig15. Areal Extent of Annual Droughts in SPI-3 IV.Conclusion Remark As a conclusion, drought affects virtually all studied areas in central dry zone and more than one half of the zone is susceptible to drought almost every year and, this study can be used as a general reference for enhancing their early warning capabilities for drought. REFERENCES 1.M. Skaf* and S. Mathbout** - “Drought changes over five decades in Syria”, 2010 – Economics of drought and drought preparedness in a climate change context. 2.Jonathan Spinoni*, Gustavo Naumann, Hugo Carrao, Paulo Barbosa and Jurgen Vogt, “World drought frequency, duration and severity for 1951–2010”. 3.Khin Thein Oo, “Spatial Analysis of Rainfall Variation in Dry Zone of Myanmar”, 2016. 4.World Meteorological “Standardized Precipitation Index User Guide”, 2012. 5.Jaber Almedeij, “Drought Analysis for Kuwait Using Standardized Precipitation Index”, 2014. 6.James E. CaskeyJr, “A note on the Gamma distribution”, 1985. Organization, @ IJTSRD | Available Online @ www.ijtsrd.com | Volume – 2 | Issue – 5 | Jul-Aug 2018 Page: 1819