Download
1 / 4
40 likes | 54 Views
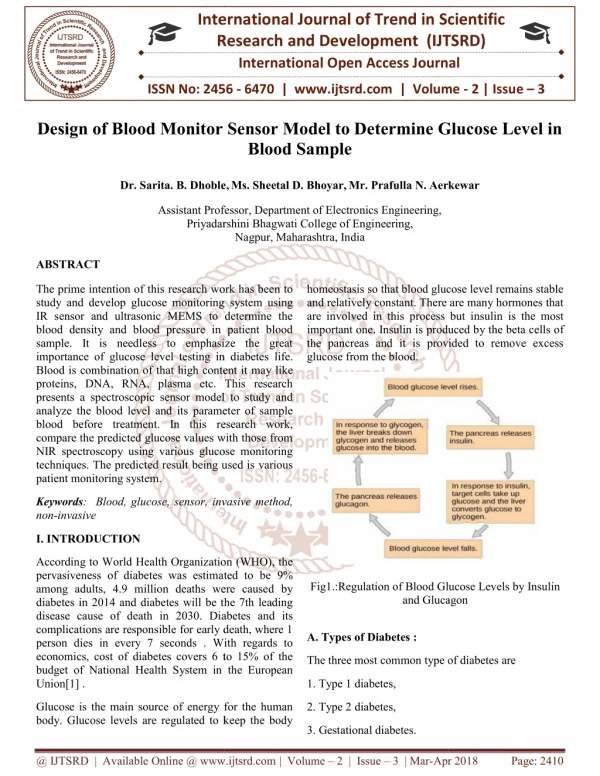
The prime intention of this research work has been to study and develop glucose monitoring system using IR sensor and ultrasonic MEMS to determine the blood density and blood pressure in patient blood sample. It is needless to emphasize the great importance of glucose level testing in diabetes life. Blood is combination of that high content it may like proteins, DNA, RNA, plasma etc. This research presents a spectroscopic sensor model to study and analyze the blood level and its parameter of sample blood before treatment. In this research work, compare the predicted glucose values with those from NIR spectroscopy using various glucose monitoring techniques. The predicted result being used is various patient monitoring system. Dr. Sarita. B. Dhoble | Ms. Sheetal D. Bhoyar | Mr. Prafulla N. Aerkewar "Design of Blood Monitor Sensor Model to Determine Glucose Level in Blood Sample" Published in International Journal of Trend in Scientific Research and Development (ijtsrd), ISSN: 2456-6470, Volume-2 | Issue-3 , April 2018, URL: https://www.ijtsrd.com/papers/ijtsrd12762.pdf Paper URL: http://www.ijtsrd.com/engineering/electrical-engineering/12762/design-of-blood-monitor-sensor-model-to-determine-glucose-level-in-blood-sample/dr-sarita-b-dhoble<br>

E N D
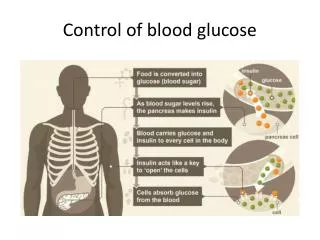
International Research Research and Development (IJTSRD) International Open Access Journal International Journal of Trend in Scientific Scientific (IJTSRD) International Open Access Journal ISSN No: 2456 ISSN No: 2456 - 6470 | www.ijtsrd.com | Volume 6470 | www.ijtsrd.com | Volume - 2 | Issue – 3 Design of Blood Monitor Sensor Model to Determine Glucose Level in Design of Blood Monitor Sensor Model to Determine Glucose Level in Design of Blood Monitor Sensor Model to Determine Glucose Level in Blood Sample Dr. Sarita. B. Dhoble Dr. Sarita. B. Dhoble,Ms. Sheetal D. Bhoyar,Mr. Prafulla N. Aerkewar Mr. Prafulla N. Aerkewar Assistant Professor Priyadarshini Bhagwati College of Engi Priyadarshini Bhagwati College of Engineering, Nagpur, Maharashtra, India Assistant Professor, Department of Electronics Engineering, ABSTRACT The prime intention of this research work has been to study and develop glucose monitoring IR sensor and ultrasonic MEMS to determine the blood density and blood pressure in patient blood sample. It is needless to emphasize the great importance of glucose level testing in diabetes Blood is combination of that high content it may like proteins, DNA, RNA, plasma etc. This research presents a spectroscopic sensor model to study and analyze the blood level and its parameter of sample blood before treatment. In this research work, compare the predicted glucose values with those from NIR spectroscopy using various glucose monitoring techniques. The predicted result being used is various patient monitoring system. The prime intention of this research work has been to and develop glucose monitoring system using IR sensor and ultrasonic MEMS to determine the blood density and blood pressure in patient blood sample. It is needless to emphasize the great level testing in diabetes life. homeostasis so that blood glucose level remains stable and relatively constant. There are many hormones that are involved in this process but insulin is the most produced by the beta cells of the pancreas and it is provided to remove excess homeostasis so that blood glucose level remains stable and relatively constant. There are many hormones that are involved in this process but i important one. Insulin is produced by the beta cells of the pancreas and it is provided to remove excess glucose from the blood. high content it may like plasma etc. This research presents a spectroscopic sensor model to study and analyze the blood level and its parameter of sample research work, compare the predicted glucose values with those from NIR spectroscopy using various glucose monitoring The predicted result being used is various Keywords: Blood, glucose, sensor, invasive non-invasive Blood, glucose, sensor, invasive method, I. INTRODUCTION According to World Health Organization (WHO), the pervasiveness of diabetes was estimated to be 9% among adults, 4.9 million deaths were caused by diabetes in 2014 and diabetes will be the 7th leading disease cause of death in 2030. Diabetes and its complications are responsible for early death, where 1 person dies in every 7 seconds . With regards to economics, cost of diabetes covers 6 to 15% of the budget of National Health System in the European Union[1] . According to World Health Organization (WHO), the pervasiveness of diabetes was estimated to be 9% among adults, 4.9 million deaths were caused by diabetes in 2014 and diabetes will be the 7th leading Fig1.:Regulation of Blood Glucose Levels by Insulin Fig1.:Regulation of Blood Glucose Levels by Insulin and Glucagon and Glucagon abetes and its complications are responsible for early death, where 1 person dies in every 7 seconds . With regards to economics, cost of diabetes covers 6 to 15% of the budget of National Health System in the European A. Types of Diabetes : The three most common type of diabetes are The three most common type of diabetes are 1. Type 1 diabetes, Glucose is the main source of energy for the human body. Glucose levels are regulated to keep the body body. Glucose levels are regulated to keep the body Glucose is the main source of energy for the human 2. Type 2 diabetes, 3. Gestational diabetes. @ IJTSRD | Available Online @ www.ijtsrd.com @ IJTSRD | Available Online @ www.ijtsrd.com | Volume – 2 | Issue – 3 | Mar-Apr 2018 Apr 2018 Page: 2410
International Journal of Trend in Scientific Research and Development (IJTSRD) ISSN: 2456-6470 Although there are also other types of diabetes including congenital diabetes, cystic-fibrosis related diabetes, and steroid diabetes. Type 1 or Insulin Dependent Diabetes Mellitus (IDDM) is an auto immune disease in which body cannot produce sufficient insulin leading to insulin deficiency due to loss of insulin- producing beta cells. Type 2 diabetes or Non-Insulin Dependent (NIDDM) is due to reduced insulin secretion. Gestational diabetes usually occurs to women during their pregnancy. It generally resolves after pregnancy or else it may lead to Type 2 diabetes. 90% cases of diabetes are of Type 2 diabetes which mostly affects the adult people. 2. Moderate hypoglycemia: Blood glucose level is between 40and 55 mg/dl. It is characterized by mood changes, confusion, blurred vision, weakness and drowsiness since it affects the central nervous system. 3. Severe hypoglycemia: Blood glucose level is less than 40 mg/dl. It is characterized by convulsions, loss of consciousness and coma. In this case glucagon injection is required. Diabetes Mellitus C. Blood Glucose Level Monitoring Long term and short term complications can be reduced through proper diet, physical exercise, and medication. But to know the pattern of glucose changes of a diabetic patient, concentration of glucose in blood (glycaemia) needs to be monitored by using invasive and non-invasive glucose monitoring techniqe. B. Complications related to Diabetes : Blood glucose level is the amount of glucose present in blood. It is commonly measured in mg/dl. Diabetes patients have abnormally excessive glucose level or diminished glucose level. Symptoms of diabetes include Polydipsia, Polyphagia, etc. as shown in Figure 2. This condition can be classified as hypoglycemic, where blood glucose level is less than 72mg/dl or hyperglycemic, where blood glucose level is more than 200mg/dl .Hypoglycemia has short term effects and it usually affects brain. It is classified on the basis of glucose level: Figure 3. Invasive (Left) and Noninvasive (Right) Glucose Monitoring II. Proposed Noninvasive Blood Glucose Level Monitoring System : A. Proposed Method : Proposed MEMS Sensor are used for monitoring the glucose concentration by using noninvasive approach. IR sensor and MEMS sensor work as a transmitter and receiver at operating point. Proposed model work on the principle of spectroscopy operating technique. Calibration system used concentration in input testing sample. to predict glucose B. Block Diagram of the Proposed Method : The proposed system with IR and ultrasonic MEMS sensors is illustrated in Figure 3. Figure 2. Symptoms of Diabetes 1. Mild hypoglycemia: Blood glucose level is between 55 and 70 mg/dl. In this case, eating small amount of carbohydrate can restore normal glucose levels. Figure 3. Block diagram of proposed NIBGM system @ IJTSRD | Available Online @ www.ijtsrd.com | Volume – 2 | Issue – 3 | Mar-Apr 2018 Page: 2411
International Journal of Trend in Scientific Research and Development (IJTSRD) ISSN: 2456-6470 Ultrasonic wave from ultrasonic MEMS sensor generates pressure wave in medium (such earlobe) and is collected by ultrasonic MEMS receiver. In order to generate ultrasonic wave, piezoelectric device is used. All the individual parts in that block diagram are explained below as follows: A (v) = -log I (v)/ I o(v) Where, A (v) = absorbance at wavelength of 1/v. v= wave number. 1. Infrared Transmitter: The functional wavelength of 2270 nm will be utilized here for the experimental purposes. T I= light intensity of the adjacent medium. I 0 = light intensity after penetrating through the medium. 2.Ultrasonic Transmitter: A piezoelectric based ultrasound transmitter with 2 MHz of operating frequency will be supplied for the generation of acoustic wave. This unit is also connected to the same side of earlobe as Infrared Transmitter. Absorbance can also defined in terms of absorptivity coefficient, concentration of molecule and path length as shown in given equation . A (v) = a*b*c 3. Infrared Receiver: The blood glucose tends to have a precise vibrational pattern for its respective concentration measurements tend to change in absorption will be responded by this very sensitive IR receiver unit. Where a = absorptivity coefficient b = path length 4. Ultrasonic Receiver: Again, the piezoelectric based ultrasound receiver with 2 MHz as operating frequency has been utilized here. The prime task of this unit is to plaid the pattern and orientations of the generated acoustic waves. c = concentration Here, c is considered as the concentration of blood glucose. So, increase in level of glucose will increase the absorbance. In this way finding the value of glucose level is achieved by comparing absorbance value to a reference absorbance value. 5. Calibration Model: The output values form two receivers will be fed to this model. Using multiple linear regression analysis, the values are processed in MATLAB to predict the blood glucose level concentration. IV. Results And Evaluation : In this paper, we present the impact of piezoelectric materials on pressure followed by pressure generated in blood and predicted blood glucose concentration. Then we compare the predicted glucose values with those from NIR spectroscopy using various glucose monitoring techniques. III. Working Principle of the Proposed Method: Ultrasonic wave is a sound wave transmitted at a frequency greater than 20 KHz or beyond the normal hearing range of human. When ultrasonic wave will pass through the biological tissue, it produces vibrational patterns into the medium. These wave can be generated from a piezoelectric transducer. This leads to the generation of acoustic energy due to its existence in the ultrasonic field. A. Noninvasive Monitoring of Blood Glucose Level Noninvasive method collect the data base by IR sensor and ultrasonic MEMS sensor and provide this data to calibration system to analyze glucose level. 1 Simulation of Different Piezoelectric Materials Hence we will be able to monitor the glucose level using the pressure Measurement This is better can be explained by Beer-Lamberts law as shown in given equation. In the analysis,for simulation purpose,blood density is considered as a basic parameters.The level of blood glucose is calculated by analyzing the value of blood density.Blood pressure is one of the prime objective to study the level of blood sample. @ IJTSRD | Available Online @ www.ijtsrd.com | Volume – 2 | Issue – 3 | Mar-Apr 2018 Page: 2412
International Journal of Trend in Scientific Research and Development (IJTSRD) ISSN: 2456-6470 2. Using Ultrasonic MEMS Sensor References : 1)World Health Organization. Diabetes. Media centreWorld Health [online].Available http://www.who.int/mediacentre/factsheets/fs312/ en/. Accessed March 28, 2015. Piezoelectric material is one of the best alternative to check pressure in patient blood sample. Alternatly this is used to calculate density of blood.As level of glocose concentration is increases,it used to increase blood density and then pressure gradient is calculated. Organization,2015. from: 2)International Atlas.IDF Diabetes Atlas, 2015 sixth edition. [online]. Available http://www.idf.org/diabetesatlas/. Accessed March 28, 2015. Diabetes Federation. Diabetes from: 3)Boundless. Metabolism.” Boundless Biology. Boundless, 03 Jul. 2014. [online]. https://www.boundless.com/biology/textbooks/bo undless-biology-textbook/the- endocrine-system- 37/regulation-of-body-processes-212/hormonal- regulation-of- metabolism-799-12035/. Accessed March 28, 2015. “Hormonal Regulation of Available from: Figure 4 (a). Waveform of Acoustic PressureGenerated in Blood of Concentration 54.05mg/dL 4)World Health Organization. About diabetes. Diabetes Programme. World Health Organization; 2015. [online]. http://www.who.int/diabetes/action_online/basics/ en/index.htmlAccessed March 28, 2015. Available from: 5)A. Ernest, “Diabetes : mellitus and its complications epidemiology, and clinical medicine,” New York Academy of Science, 2006,vol. Xiv, pp.532. molecular mechanisms, 6)Main symptoms of diabetes. [Online]. Available: http://commons.wikimedia.org/wiki/File:Main_sy mptoms_of_diabetes.svg. Accessed March 28, 2015. Figure 4 (b). Waveform of Acoustic Pressure Generated in Blood of Concentration 180.18mg/dL Conclusions : 7)S.N. Davis and G. Lastra-Gonzalez, “Diabetes and Low Blood Sugar (Hypoglycemia),” Journal of Clinical Endocrinology & Metabolism, 2008, vol. 8 pp. 93. Both long term and short term complications from diabetes can be reduced through suggest diet, physical exercise, and proper medication. In order to determine the appropriate drugs, blood glucose concentration is regularly monitored. However, traditional invasive blood glucose monitoring systems are expensive, inconvenience, and painful (due to pricking fingers). 8)Chi-Fuk So, Kup-Sze Choi, Thomas KS Wong, and Joanne WY Chung, “Recent advances in noninvasive glucose Devices: Evidence and Research, June 27, 2007. monitoring,” Medical Proposed method is used to direct patient pressure gradient. It is used to monitor patient blood glucose level by calculating blood glucose density. 9)Invasive Glucose Meter. [online]. Available: http://www.wisegeek.com/how-do-i- choose-the- best-non-invasive-glucose-meter.htm. March 28, 2015. Accessed @ IJTSRD | Available Online @ www.ijtsrd.com | Volume – 2 | Issue – 3 | Mar-Apr 2018 Page: 2413