Download
1 / 28
280 likes | 430 Views
Highways and Sprawl in North Carolina. David T. Hartgen Professor of Transportation Studies UNC Charlotte dthartge@email.uncc.edu A Report for the John Locke Foundation Raleigh, North Carolina www.johnlocke.org September 24, 2003. Do Roads Cause Sprawl?.

E N D
Highways and Sprawl in North Carolina David T. Hartgen Professor of Transportation Studies UNC Charlotte dthartge@email.uncc.edu A Report for the John Locke Foundation Raleigh, North Carolina www.johnlocke.org September 24, 2003
Do Roads Cause Sprawl? • Road Improvements may lead or follow growth. • Growth depends on many factors, including roads. • Growth and roads often occur together. • In other cases, growth is occurring without road improvements
Highways and Sprawl in North Carolina • Goal • Locate population growth and all major road improvements, 1990-2000 • Determine correlation between population growth, road investments, and other factors • Urban and Rural Areas, All 1551 Tracts
Method of Analysis • 100 NC Counties • Trends in Population, Employment, Commuting. • 12 “Commuting Regions” • 17 NC Urbanized Areas • Trends in Population Density, Traffic, Congestion. • 1551 NC Tracts • Road Investments, Demographics, Density. • Data from TIPs, 1990 and 2000 Census. • Statistical models of growth. • Rural and urban analysis.
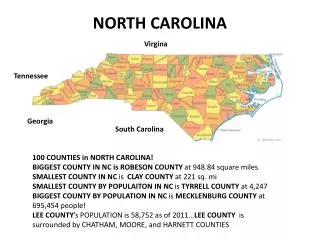
County Population Change, 1990-2000 • Growth Throughout NC • 97 of 100 Counties increased • Strong Growth in many Suburban, rural and urban counties • Interstate access varies
Freeway Traffic Per Lane, 1990-2001 • Generally,more traffic in larger cities • 28 % Growth • Most traffic lower than US averages • Charlotte, Gastonia, Concord have the highest traffic/lane
NC Commuting, 2000 Census • 12 Regions, based on commuting in 2000 • Work travel is about 25 % of all travel • Cross-county work travel is 61% of work travel
Population Growth and Major Road Projects, 1990-2000 • Tract growth throughout NC • Suburban, Urban, Rural • Ave growth: 972 (21%) • 312 Major Road Projects • New: 111 Projects, $ 3.1 B • Widenings: 201 Projects, $3.1 B • 1558 Miles, $6.2 B
327 tracts, 69 road projects • Ave growth: 1099 (27%) • Fastest growth in suburban tracts • Growth correlation 0.23 • Key: prior density • Secondary factors: • Income • Distance to City Center • Road Effects: • UrbanWidening: + 525 persons, per mile (13 %) • New 4-Lane Arterial: 456/mile(11 %)
Charlotte Region-West • Growth lower and more dispersed • Weak link to road projects or prior Interstates
Charlotte Region Population Density, 1990-2000 • Densities increasing in all distance rings • Maximum densities 1700-1900 per sq mi. • Greatest increases in 8-15 mile rings
Triangle Region • 259 tracts, 41 road projects • Ave growth: 1513 (36%) • Fastest growth in suburban Wake and nearby • Less growth in denser inner tracts • Growth Model Correlation 0.22 • Key: prior density • Secondary: Distance to City Center
Road Effects on Growth • Widen Freeway to 8 lanes: - 1130 / mile (-28%) • New Freeway: +354 / mile(8%) • Densities rising throughout, including inner rings
Triad Region • 323 tracts, 57 road projects • Ave growth: 709 (17%) • Growth more dispersed, fastest in suburban rings • Densities rising, but less rapidly
Triad Region • Correlation: 0.22 • Key: Prior Density • Secondary: Dist to Interstates Road Effects: Widened Urban Arterial: +237 / mile (6%) New Freeway Exit: + 4845 / mile(136%)
Asheville Region • 87 tracts, 21 road projects • Ave growth: 792 (20%) • Dispersed thru region • Correlation: 0.45 • Key: Prior Density • Secondary: Distance to Interstate Road Effects: Urban Widening: +107/mile (2.7%) Rural Widening: + 553/mile (14%) New Freeway: + 86/mile (2.2%)
Wilmington Region • 61 tracts, 12 road projects • Ave growth: 1502 (39%) • Fastest near Wilm and coast • Correlation: 0.25 • Key: Prior Density • Secondary: Dist to City Center • Densities rising in city core • NO strong road effects
Fayetteville Region • 126 tracts, 38 road projects • Ave growth: 722 (15%) • Dispersed, but fastest north and east of Fayetteville • Military reductions • Correlation: 0.11 • Key: Prior Density • Secondary: Distance to City Center Road Effects: Rural Widenings: +207 pop/mile (3.6%)
Jacksonville Region • 55 Tracts, 5 Road Projects • Ave Growth: 1137 ( 25 %) • Fastest near Coast • Military Impacts • Correlation: 0.20 • Key: Distance to Coast • Road Effect: • Widen Rural Arterial : + 193/mile
Greenville-Rocky Mount Region • 157 tracts, 35 road projects • Ave growth: 495 (11%) • Very dispersed growth, some declines • Correlation: 0.16 • Key factors: • Prior income • Pct Non-white population • NO Road Effects
Eastern North Carolina Region • 27 Tracts, 11 Road Projects • Ave Growth: 1499 (46%) • Fastest near coast • Correlation: 0.34 • Key Factor: Prior Density • Secondary: • Distance to Coast • Road Effects; • Widen Rural Arterial: + 51/mile(1.5%) • Widen Urban Arterial + 144/mile ( 3.2%)
Hickory-Morganton Region • 77 Tracts, 13 Road projects • Ave Growth: 726 (17%) • Faster along I-40 • Correlation: 0.07 • Key Factor: Prior Density • Secondary: Dist To Interstate • NO Road Effects
Boone-Spruce Pine Region • 22 Tracts, 4 Road Projects • Ave Growth: 530 (15%) • Fastest near Parkway • Correlation: 0.45 • Key Factor: Dist to Parkway • Road Effects: • Widen Rural Arterial: + 123/mile(3.3%)
Western NC Region • 30 tracts, 6 road projects • Ave growth: 694 (21%) • Dispersed growth, no urban focus. • Correlation: 0.11 • Key: Distance to Parkway • Road Effects: Rural Widening: + 78/mile (2.1%)
Summary • Local Factors largely determine growth • Zoning and densitycaps • Community economy and attitude • Taxes and schools • Utilities • Key is prior density: • growth goes where there is room for it • Region grows outward if it can’t grow upward • Zoning determines permissible growth, pushes growth outward • Secondary factors: • Distance to City Center, Income
Most Growth is NOT Road-Related • 61 % of Tracts had NO Major Projects during the 1990s • 50 % of growth was in tracts with NO ROAD PROJECTS • Only 23 % of growth was in tracts that had Road Widenings
Road Effects on Growth Rates • 2-14 percent points, per decade, per mile. • Rural Widenings: 1.5 % (Eastern NC) to 13.9 % (Asheville) • Urban widenings: 2.7 % (Asheville) to 12.8 % (Charlotte) • New Arterial 10.9% (Charlotte) • Widen Frwy to 8 L - 28.1 % (Raleigh) • New Freeway 2.2 % (Asheville) to 8.4 % (Raleigh) • New Freeway Exit 0 (11 regions) to 120 % (Triad) • Maximum traffic impact: a small McDonald’s • At Maximum, About 15% of Added Capacity • Generally minor, compared to background growth and other effects
Policy Implications • Determinants of growth are largely local. • Local governments have the lead in directing growth. • Prior Density is the key: Near cities, growth goes where there is room for it. • Density caps push growth outward. • Road improvements have minor effects on growth • Generally 2-14% percent points per decade • At maximum: a small fast-food restaurant. • Transportation Improvements are generally blunt, inefficient means of spurring or slowing growth • Make such actions to improve mobility or access, not to influence growth. • Select projects on the basis of impact on traffic.