Download
1 / 12
120 likes | 240 Views
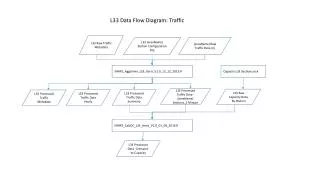
Jam and Fundamental Diagram in Traffic Flow on Sag and Hill. K.Komada S.Masukura T.Nagatani Shizuoka Univ. Japan. Purpose of Study. Proposal of traffic model including the gravitational force - We extend the optimal velocity model to study the

E N D
Jam and Fundamental Diagram in Traffic Flow on Sag and Hill K.Komada S.Masukura T.Nagatani Shizuoka Univ.Japan
Purpose of Study • Proposal of traffic model including the gravitational force -We extend the optimal velocity model to study the jamming transition induced by the gravitational force. • Fundamental diagrams for the traffic flow on sag and hill -We study the flow, traffic states ,and jamming transitions induced by sag and hill. • Jam induced by sag -We clarify the relationship between densities before and after the jam from the theoretical current curves.
Traffic model Equation of motion on uphill About → 1 for → ∞ sensitivity → 0 for → 0 depends on the gradient of Extended Optimal velocity Function We extend the OV model and obtain the following
① ① ③ ② ①OV function on normal section ② Extended OV function on uphill section ③Extended OV function on downhill section
Simulation method • Single lane • The periodic boundary condition • Forth-order Runge-Kutta method Values of parameters • LN1=LD1=LU1=LN2=L/4 • Time interval isΔt=1/128 • Vf,max=2.0,xc=4.0 • Number of cars N=200 • Length of road L=N×Δx
Fundamental diagram( Xc=Xdown,b=Xup,b) Sensitivity:a=3.0>ac=2.0(critical value) Sensitivity:a=1.5<ac=2.0(critical value) Traffic jam induced by sag Velocity profile(ρ=0.17) Traffic jam induced by sag +oscillating jam at low sensitivity High sensitivity⇒3 traffic states Low sensitivity ⇒5 traffic states Velocity profile ( ρ=0.19)
Relationship between headway profile and theoretical current(Xc=Xup,b=Xdown,b) Headway profile(ρ=0.16) Steady state: Headways are the same. Velocities are Optimal Velocity. Theoretical current ( in the case of no jam at high sensitivity) Headway profile(ρ=0.20)
Fundamental diagram( Xc=Xdown,b≠Xup,b) Velocity profile(ρ=0.16) 3 traffic states (3) of case2 is not consistent with that of case1 but (1) and (2) case 2 agree with those of case1. (1)Free traffic (2)Traffic with saturated current (3) Congested traffic Headway profile(ρ=0.16) xc=xup,b≠xdown,b:「the different case」(case1)xc=xup,b=xdown,b :「the same case」(case2)
Relationship between headway profile and theoretical current ( Xc=Xdown,b≠Xup,b) Headway profile(ρ=0.16) In the case of Xc=Xdown,b≠Xup,b The length of jam shorten. Headway get narrow. Headway profile(ρ=0.20)
The dependence of traffic flow on the gradient Velocity profile(ρ=0.20) As the gradient is high, the maximum velocity become lower and higher on up- and down-hills respectively. The region of saturated flow extend. The maximum current is lower. Headway profile(ρ=0.20)
Fundamental diagram of traffic flow with two uphills Headway profile(ρ=0.20) The traffic jam occurs just before the highest gradient. Headway profile(ρ=0.20)
Summary ●We have extended the optimal velocity model to take into account the gravitational force as an external force. ● We have clarified the traffic behavior for traffic flow on a highway with gradients ●We have showed where, when, and how the traffic jams occur on highway with gradients. ● We have studied the relationship between densities before and after the jam from the theoretical analysis.