Download
1 / 17
170 likes | 203 Views
Learn the logic and formulas in repeated-measures ANOVA, how individual differences are handled, and comparing it with independent-measures ANOVA.

E N D
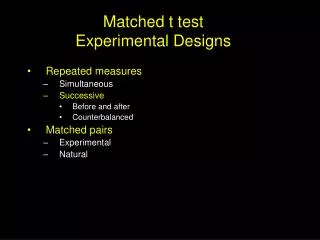
The Logical Background for a Repeated-Measures ANOVA • Chapter 14 extends analysis of variance to research situations using repeated‑measures (or related‑samples) research designs. • Much of the logic and many of the formulas for repeated‑measures ANOVA are identical to the independent‑measures analysis introduced in Chapter 13. • However, the repeated‑measures ANOVA includes a second stage of analysis in which variability due to individual differences is subtracted out of the error term.
The Logical Background for a Repeated-Measures ANOVA (cont.) • The repeated‑measures design eliminates individual differences from the between‑treatments variability because the same subjects are used in every treatment condition. • To balance the F‑ratio the calculations require that individual differences also be eliminated from the denominator of the F‑ratio. • The result is a test statistic similar to the independent‑measures F‑ratio but with all individual differences removed.
Comparing Independent-Measures and Repeated-Measures ANOVA • The independent-measures analysis is used in research situations for which there is a separate sample for each treatment condition. • The analysis compares the mean square (MS) between treatments to the mean square within treatments in the form of a ratio MS between treatments F = ─────────── MS within treatments
Comparing Independent-Measures and Repeated-Measures ANOVA (cont.) • What makes the repeated-measures analysis different from the independent-measures analysis is the treatment of variability from individual differences. The independent-measures F ratio (Chapter 13) has the following structure: MS between treatments treatment effect + error (including individual differences) F = ──────────── = ─────────────────────────────────── MS within error (including individual differences) • In this formula, when the treatment effect is zero (H0 true), the expected F ratio is one.
Comparing Independent-Measures and Repeated-Measures ANOVA (cont.) • In the repeated-measures study, there are no individual differences between treatments because the same individuals are tested in every treatment. • This means that variability due to individual differences is not a component of the numerator of the F ratio. • Therefore, the individual differences must also be removed from the denominator of the F ratio to maintain a balanced ratio with an expected value of 1.00 when there is no treatment effect.
Comparing Independent-Measures and Repeated-Measures ANOVA (cont.) • That is, we want the repeated-measures F-ratio to have the following structure: treatment effect + error (without individual differences) F = ──────────────────────────────────── error (with individual differences removed)
Comparing Independent-Measures and Repeated-Measures ANOVA (cont.) • This is accomplished by a two-stage analysis. In the first stage, total variability (SS total) is partitioned into the between-treatments SS and within-treatments SS. • The components for between-treatments variability are the treatment effect (if any) and error. • Individual differences do not appear here because the same sample of subjects serves in every treatment. On the other hand, individual differences do play a role in SS within because the sample contains different subjects.
Comparing Independent-Measures and Repeated-Measures ANOVA (cont.) • In the second stage of the analysis, we measure the individual differences by computing the variability between subjects, or SS between subjects • This value is subtracted from SS within leaving a remainder, variability due to experimental error, SS error
Comparing Independent-Measures and Repeated-Measures ANOVA (cont.) • A similar two-stage process is used to analyze the degrees of freedom. For the repeated-measures analysis, the mean square values and the F-ratio are as follows: SS between treatments MS between treatments = ─────────── df between treatments SS error MS between treatments MS error = ───── F = ────────── df error MS error
Comparing Independent-Measures and Repeated-Measures ANOVA (cont.) • One of the main advantages of the repeated-measures design is that the role of individual differences can be eliminated from the study. • This advantage can be very important in situations where large individual differences would otherwise obscure the treatment effect in an independent-measures study.
Measuring Effect Size for the Repeated-Measures Analysis of Variance • In addition to determining the significance of the sample mean differences with a hypothesis test, it is also recommended that you determine the size of the mean differences by computing a measure of effect size. • The common technique for measuring effect size for an analysis of variance is to compute the percentage of variance that is accounted for by the treatment effects.
Measuring Effect Size for the Repeated-Measures Analysis of Variance (cont.) • In the context of ANOVA this percentage is identified as η2 (the Greek letter eta, squared). • Before computing η2, however, it is customary to remove any variability that is accounted for by factors other than the treatment effect. • In the case of a repeated-measures design, part of the variability is accounted for by individual differences and can be measured with SS between subjects.
Measuring Effect Size for the Repeated-Measures Analysis of Variance (cont.) • When the variability due to individual differences is subtracted out, the value for η2 then determines how much of the remaining, unexplained variability is accounted for by the treatment effects. • Because the individual differences are removed from the total SS before eta squared is computed, the resulting value is often called a partial eta squared.
Measuring Effect Size for the Repeated-Measures Analysis of Variance (cont.) • The formula for computing effect size for a repeated-measures ANOVA is: SS between treatments SS between treatments η2 = ───────────── = ────────────── SS total - SS between subjects SS error + SS between treatments