Download
1 / 65
670 likes | 990 Views
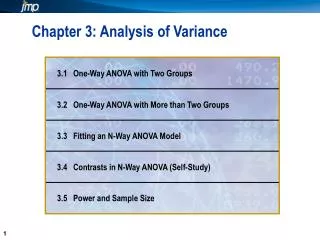
5. Chapter 3: Analysis of Variance. 5. Chapter 3: Analysis of Variance. Objectives. Understand the use of sums of squares for comparing group means. Use JMP to perform a one-way ANOVA. Compare the one-way ANOVA with two groups to the two sample t -test. Sums of Squares.

E N D
5 Chapter 3: Analysis of Variance
5 Chapter 3: Analysis of Variance
Objectives • Understand the use of sums of squares for comparing group means. • Use JMP to perform a one-way ANOVA. • Compare the one-way ANOVA with two groups to the two sample t-test.
Total Sum of Squares (7-6)2 (3-6)2 SST = (3-6)2 + (4-6)2 + (5-6)2 + (7-6)2 + (8-6)2 + (9-6)2 = 28
Error Sum of Squares (7-8)2 (5-4)2 SSE = (3-4)2 + (4-4)2 + (5-4)2 + (7-8)2 + (8-8)2 + (9-8)2 = 4
Model Sum of Squares 3*(8-6)2 3*(4-6)2 SSM = 3*(4-6)2 + 3*(8-6)2 = 24
The Reference Distribution Compute for your sample and compare the sample F to the reference distribution.
3.01 Multiple Answer Poll • The model sum of squares (SSM) describes which of the following? • The variability between the groups • The variability within the groups • The variability explained by the grouping variable
3.01 Multiple Answer Poll – Correct Answers • The model sum of squares (SSM) describes which of the following? • The variability between the groups • The variability within the groups • The variability explained by the grouping variable
The One-Way ANOVA Model and Standard Assumptions • = + + • Yik = µ + τi + εik • The errors are normally distributed with a mean of zero. • The variance is the same for all groups. • The errors occur independently of one another. Strength of Concrete Type of Additive Unexplained Variation Base Level
Concrete Example Reinforced Standard
Comparing Two Means Using a One-Way ANOVA • This demonstration illustrates the concepts discussed previously.
3.02 Quiz • Match the significance test output on the right to the correct null hypothesis on the left. H0: σ21 = σ22 H0: μ1 = μ2 H0: data from normal distribution A. B. C.
3.02 Quiz – Correct Answer • Match the significance test output on the right to the correct null hypothesis on the left. H0: σ21 = σ22 H0: μ1 = μ2 H0: data from normal distribution A. B. C. 1-A, 2-C, 3-B
3.03 Quiz • Which of the following statements are true at α=0.05? There is not sufficient evidence to reject equal variances. There is not sufficient evidence to reject equal means. There is not sufficient evidence to reject normality.
3.03 Quiz – Correct Answer • Which of the following statements are true at α=0.05? There is not sufficient evidence to reject equal variances. There is not sufficient evidence to reject equal means. There is not sufficient evidence to reject normality. (2 is false because the p-value is .0011, so there is sufficient evidence to reject H0: µ1= µ2atα = 0.05)
5 Chapter 3: Analysis of Variance
Objectives • Fit a one-way ANOVA with more than two groups. • Use multiple comparisons procedures to determine which means are significantly different.
Insulation Example • Do additives differ in their effectiveness at enhancing the properties of an insulator?
The One-Way ANOVA Hypothesis H1: At least one H0: All means equal mean different 80 80 60 60 40 40 20 20 0 0 H0: μ1 = μ2 = μ3 H1: not (μ1 = μ2 = μ3)
Fitting a One-Way ANOVA Model with More than Two Groups • This demonstration illustrates the concepts discussed previously.
Multiple Comparisons Methods Control Compare Each Pair Comparisonwise Pairwise t-Tests Error Rate Compare All Pairs Control Tukey-Kramer Experimentwise Error Rate Compare with Control Dunnett's Test
Experimentwise Error Rates • Comparisonwise error rate = 0.05 • EER 1-(1-a)nc where nc = number of comparisons
Generating Multiple Comparisons • This demonstration illustrates the concepts discussed previously.
3.04 Multiple Choice Poll • A statistically conservative method tends to do which of the following? • Find more significant differences than might otherwise be found • Vary in its findings, depending on the observed data • Find fewer significant differences than might otherwise be found
3.04 Multiple Choice Poll – Correct Answer • A statistically conservative method tends to do which of the following? • Find more significant differences than might otherwise be found • Vary in its findings, depending on the observed data • Find fewer significant differences than might otherwise be found
Exercise • This exercise reinforces the concepts discussed previously.
5 Chapter 3: Analysis of Variance
Objectives • Fit an N-way ANOVA model. • Understand interactions in ANOVA. • Use JMP to fit a model with interactions. • Compare response groups.
Neutralization Example • Do different diluents and buffers affect the final pH of media? • Is there an interaction between these predictors?
Interactions • When the interactions are not significant, you can usually delete the interactions and analyze just the main effects. • When the interactions are significant, you should not delete them or their corresponding main effects from the model. Try to understand the interactions by examining the interaction plots.
The N-Way ANOVA Model and Standard Assumptions • Yijk = µ + αi + τj+ (ατ)ij+ εijk • The errors are normally distributed with a mean of zero. • The variance is the same for all groups. • The errors occur independently of one another. Base Level = + + + + Interaction pH Diluent Buffer Residual
Residuals • The residuals represent the random variation in the statistical model. • You expect them to do the following: • display no particular pattern (unbiased) • be normally distributed • exhibit constant variance (independent of response) • be independent (no correlation)
ANOVA with TwoCategorical Predictors • This demonstration illustrates the concepts discussed previously.
Exercise • This exercise reinforces the concepts discussed previously.
5 Chapter 3: Analysis of Variance
Objectives • Understand the use of contrasts. • Use JMP to construct contrasts in N-way ANOVA.
Examining a Contrast • This demonstration illustrates the concepts discussed previously.