Download
1 / 20
200 likes | 339 Views
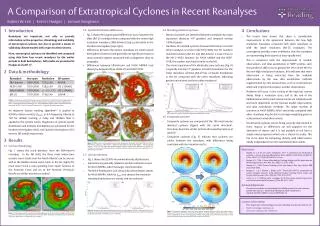
SPATIAL DISTRIBUTION OF EMISSIONS IN DENMARK. Marlene Plejdrup & Steen Gyldenkærne Department of Policy Analysis National Environmental Research Institute Aarhus University. TFEIP Emissions Gridding and Mapping Workshop Stockholm, May 4 th , 2011. Outline. Emission gridding in Denmark

E N D
SPATIAL DISTRIBUTION OF EMISSIONSIN DENMARK Marlene Plejdrup & Steen Gyldenkærne Department of Policy Analysis National Environmental Research Institute Aarhus University TFEIP Emissions Gridding and Mapping Workshop Stockholm, May 4th, 2011
Outline • Emission gridding in Denmark • The SPREAD model • Gridded emissions: • stationary combustion • agriculture • mobile sources • national emissions • Application of gridded emissions
Danish emission gridding • Previous griddings: • Danish emission on 50 km grid – reporting to LRTAP • National emissions on 17 km grid – special focus on road transport and residential wood burning • Emissions from road transport and residential wood burning for case areas on 1 km grid. • Agricultural NH3 on 100 m grid • New gridding model, SPREAD: • Gridding of all emissions in the Danish emission inventories on 1 km grid.
The SPREAD Model- Spatial High Resolution Emission to Air Distribution Model SPREAD includes ● 10 sub-models ● > 15 databases ● > 30 distribution keys ● > 50 distribution ● a module for extraction of results ● all or selected pollutants ● all or selected sources ● customised aggregation level, e.g. sectoral total or source level
Methodology • Gridding on most disaggregated level as possible • Source, SNAP, sub-sector or sector • Distribution level is determined by: • evaluation of the best potential way of distribution • examination of data availability • Distribution keys in GIS (Geographical Information System) • intersection • share of area or length for each grid cell • Emissions • from the emission inventory for 2008 or calculated (stationary combustion and agriculture). Calculated emissions are corrected to match reported emissions. • Visualisation of results in GIS
Stationary combustion – sources and data • LPS • UTM coordinates are included in the Danish inventory system • PS • The “Energy Producer Accounts” from DEA • annual database including fuel consumption (FC) and geographical coordinates for each district heating and/or power producing plant • AS • National FC from the Danish Energy Statistics by DEA excluding LPS and PS
Stationary combustion – emission calculation • FC on different level for LPS, PS and AS • extraction of LPS from PS to avoid double-counting • extraction of LPS and PS from AS to avoid double-counting • need for manual re-allocation of FC, as LPS and PS is on SNAP3 level and the national energy statistics on SNAP2, leading to FC deficits for AS • need for corrections of calculated emissions to ensure agreement with the national emission inventory
Stationary combustion - gridding • LPS and PS at exact location and afterwards aggregated on 1 km grid • Gridding of AS mainly follows a regional inventory on municipality level from DEA including FC for regional heating for oil boilers, natural gas boilers and solid fuel installations. • Sources and fuels not included in the regional inventory are gridded in accordance with the most similar source or fuel, e.g. • small amounts of petroleum coke and LPG is treated as wood and other wood waste primary located on residential plants • small amounts of residual oil allocated on area sources are gridded according to industrial areas
Agriculture • Complex model building on many methods in the Danish NH3 gridding on 100 m • Buttom-up approach • individual animal • farm level • field level
Agriculture – background data • CHR - central husbandry register • population and location of animals on farm level • livestock, pig, sheep, goat, deer, fox, mink and animals in aquaculture • livestock are registered individually • GLR - general agriculture register • information on farms (e.g. cvr number and animals) and crops on field level • CVR – central business register • XY coordinates for e.g. farms with a CVR number • Fertiliser account • purchased N at farm level • LPIS - Land Parcel Identification System • land parcels as polygons • land parcels are split by natural boundaries, e.g. trenches and hedgerows • on average one land parcel covers approximately 11 hectares and includes 3 fields
Mobile sources • The national road and traffic database: • Annual mileage • aggregated on 1 km grid • Vehicle types: • passenger cars • vans • trucks and buses • Road types: • highway • urban road • rural road • AIS (Area Information System): • National maps of spatial • data related to nature and • environment. • E.g. railways, industrial • areas and low settlements.
National emissions • Emissions from the sub-models are gathered in a separate database used for data extraction. • SPREAD is based on 2008 emissions. A number of modifications are necessary to apply SPREAD to other years. e.g.: • Stationary combustion PSs according to the annual “Energy Producer Accounts” from DEA for plants delivering heat and/or power to the public network. • Stationary combustion AS, as PS affect this distribution key • Agricultural emissions according to annual data on animals, fertilizers and crops. • Distribution keys for a large number of minor sources are applicable for more/all years.
Application of gridded emissions • Dispersion models: • The regional 3D grid model DEHM (the Danish Euleric Hemispheric Model) on 5.55 km grid (50 km EMEP grid / 9) • The gaussian plume model UBM (Urban Background Model) • including emissions from SPREAD has improved the results from the UBM calculations, which now are more in line with measurements in the urban areas • Air quality modelling are used in exposure studies, health effect studies and cost-benefit estimations.
Further information • Plejdrup, M.S. & Gyldenkærne, S. 2011: Spatial distribution of emissions to air – the SPREAD model. National Environmental Research Institute, Aarhus University, Denmark. 72 pp. – NERI Technical Report no. FR823. http://www.dmu.dk/Pub/FR823.pdf