Download
1 / 24
270 likes | 627 Views
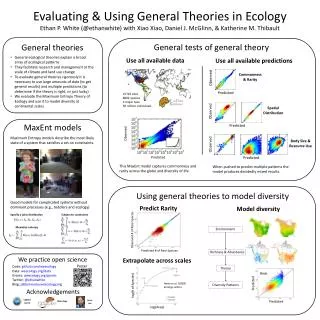
Air Pollution Control and NIR Division. Modelling the spatial distribution of particulate matter in Switzerland. Rudolf Weber, Air Quality Management Section Swiss Federal Office for the Environment. 26. October 2006. Is particulate matter a problem in Switzerland?. Air quality limit values.

E N D
Air Pollution Control and NIR Division Modelling the spatial distribution of particulate matter in Switzerland Rudolf Weber, Air Quality Management SectionSwiss Federal Office for the Environment 26. October 2006
Is particulate matter a problem in Switzerland? Air quality limit values
Measurements More than 60 stations
PM10: Evolution => Constant since 2000
Maps • Why maps? • Better visualization • Population exposure • Models based on emission grids allow reduction scenarios • Models • 3d chemical models • simple dispersion, no chemistry • interpolation from measured data
Modelling concept Source-receptor matrix; 1-year meteorology Emission grids with temporal cycles Primary <-> secondary (from precursor maps) Only annual mean values BUWAL report: UM-169, 2003„Modelling of PM10 and PM2.5 ambient concentrations in Switzerland“
Emissions • Emissions of primary particles • Road: traffic model „bottom-up“ • Rail: „top-down“ • Air: up to 200 m, ZH, GE • Industry, households, agriculture/forestry: „top-down“, area statistics • Secondary particles • 1) Concentration maps of precursors, spatially smoothed (reaction time) • NO2 => NH4NO3 • SO2 => (NH4)2SO4 • 2) Emission grids of precursors • anthropogenic und biogenic VOC
Background Background (Imported and not modelled fractions) from particulate sulfate: Height profile of primary PM + secondary PM (modell versus resulats of NFP41) + Contribution in Ticino + Contribution in Sottoceneri Includes undidentified / not quantified Swiss sources (like ships, air traffic > 200 m …)
Dispersion • Dispersion • Source-receptor method (Gaussian model) • Near-area: 200 m-grid on 6 x 6 km2 area • Far-area: 2 km-grid on 200 x 200 km2 area • Following TA Luft 1986, Stability from Swiss Meteorological Institute • Meteo-data: 1h-values of the year 1998 • Source categories • Elevated (20 m): Diurnal cycle in 4 seasons • ground-level: Diurnal cycle • => Different source-receptor matrices
Transfer functions for PM2.5 Short-range Long-range 6 km 420 km Alpine valley Isotropic
Climatological regions • Swiss Plateau region • Alpine valleys • remaining part of Switzerland
Flow chart of dispersion model Example: road passenger traffic Idea: split emissions, sum up ambient concentrations
Model structure For secondary PM: conversion from precursor maps
Model versus measurements 1.33 0.75 Modelled PM10 Street canyon, flat model Alpine valleys Measured PM10
Scenario “maximum feasible reduction” • Primary PM: - 40% • Precurors of secondary PM: - 20% PM10 in 2010
maximum feasible reduction: PM2.5 PM2.5 in 2010
Population exposure 41% of population live in areas above annual air quality limit (annual mean > 20 μg/m3) Average population eposure Anthropogenic CH 9.5 μg/m3 Anthr. not-CH 8.7 μg/m3 (or ignored, underest., unknown) Natural 1.4 μg/m3 Total 19.6 μg/m3 Influence of road traffic 22% Measurements:road traffic 33% urban background, 45% street canyon
Population exposure from measurements Idea: use the measured data of stations not as area representative but as type representative. Types of stations in national network Suburban
Summary Simple dispersion model agrees well with measurements. Estimation of population exposure with station data is possible. Use type of station, not simply the location and area. Future: Include soot (EC), BaP Full chemical model (CamX) Interpolation from measurements