Download
1 / 25
250 likes | 271 Views
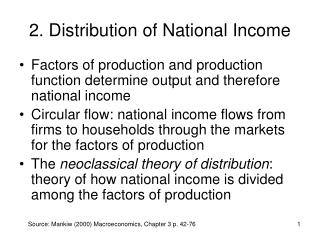
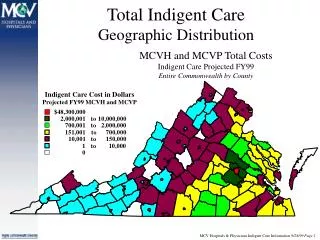
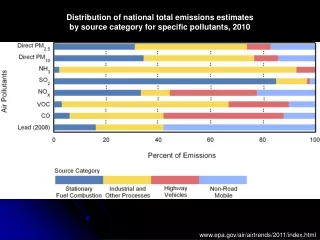
Distribution of national total emissions estimates by source category for specific pollutants, 2010. www.epa.gov/air/airtrends/2011/index.html. Air Pollution – Components Particulate Matter Sources Combustion of fossil fuels, especially coal Mobile sources – Cars, trucks

E N D
Distribution of national total emissions estimates by source category for specific pollutants, 2010 www.epa.gov/air/airtrends/2011/index.html
Air Pollution – Components • Particulate Matter • Sources • Combustion of fossil fuels, especially coal • Mobile sources – Cars, trucks • Stationary sources – Power plants, industrial furnaces, wood stoves • Dust production – Agriculture, unpaved roads • Effects • By the 1950s, air quality in London had deteriorated so much that incidences of death due to pollution weren’t uncommon • 1952 – “Killer Smog” in London 4000+ deaths • Health – Respiratory impairment, lung damage, lung cancer • Especially children, elderly, people with chronic respiratory problems • Acidic PM can damage structures, reduce visibility
LA - 1943 NYC - 1963
Air Pollution – Components • Particulate Matter • Trends • EPA Standards • Pre-1987 – TSP (Total Suspended Particulates) • Post-1987 – PM10 (Particles < 10 μm) • Post-1997 – PM2.5 (Particles < 2.5 μm) • NAAQS for PM10 • Annual average = 50 μg m-3 (revoked Dec 2006) • Daily peak = 150 μg m-3 • NAAQS for PM2.5 • Annual average = 15 μg m-3 • Daily peak = 35 μg m-3
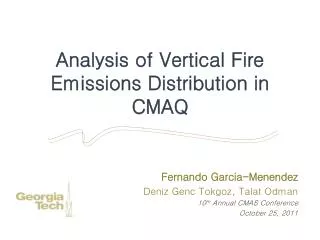
PM10 1990-2010: Direct PM10 emissions down 67% PM2.5 1990-2010: Direct PM2.5 emissions down 55% http://www.epa.gov/air/airtrends
Air Pollution – Components • Carbon Monoxide • Colorless, odorless gas • Produced by incomplete combustion of fossil fuels (too little O2 supplied in a normally tuned engine) • Sources • About 56% of CO emissions nationwide from motor vehicles • In cities, 85-95% of CO from motor vehicles • Diesel engines typically produce less CO but more PM than gasoline engines • Alternative to complete combustion of fuel is combustion of exhaust • Produces hazardous amounts of heat • Combustion temperature can be lowered using catalyst • Chemical catalysts poisoned by lead
Air Pollution – Components • Carbon Monoxide • Effects • CO binds to hemoglobin in place of oxygen • Affinity for CO ~ 200x higher than for O2 • Continued exposure can lead to • Impairment of vision • Difficulty estimating time • Reduced manual dexterity • Poor learning ability • Difficulty performing complex tasks • Greater risk of heart attacks in people with certain forms of heart disease (e.g. angina) • Contributes to formation of ground-level ozone
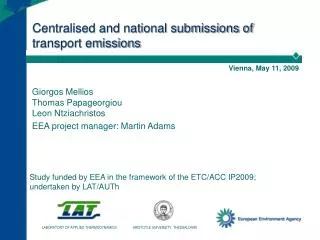
Carbon Monoxide 1990-2010: CO emissions down 60% 1990-2010: Vehicle miles traveled increased 40%
Air Pollution – Components • Nitrogen Oxides (NOx) • Principally NO2 • Highly reactive reddish-brown gas • Play a major role in the formation of ozone, PM, haze and acid rain • Important component of photochemical smog • Sources • Forms from FF combustion at high temperatures • Mobile – Cars & trucks (56%) • Stationary – Power plants (33%), home heaters, gas stoves, industrial plants (11% total) • Formation could be controlled by using pure oxygen for combustion (impractical and dangerous) • Formation reduced by low-temperature combustion
Air Pollution – Components • Nitrogen Oxides (NOx) • Effects • Strong oxidizing agent • Reacts readily in air to form nitric acid and nitrates • Health • Irritates lungs and lower resistance to respiratory infections • Lung damage • Environment • Damages plant foliage, impairs growth • Precursor of ground-level ozone, PM, smog • Contributes to acid rain - Leaching of minerals from soil - Acidification of lakes and waterways • Contributes to eutrophication of lakes & waterways • Contributes to global warming (N2O)
NO2 1990-2010: NOx emissions down 48%
Air Pollution – Components • Ground-Level Ozone (O3) • Primary constituent of photochemical smog • Secondary pollutant (ground-level ozone) • Formed from NOx and volatile organic chemicals (VOCs) in the presence of heat and sunlight • Sources • Gasoline vapors (gas tanks, gas cans) • Chemical solvents (chemical plants, factories, refineries, commercial products) • Fossil fuel combustion (motor vehicles) • Precursor gas emissions may be concentrated in one area, but gases may be carried far from sources before forming ozone
Air Pollution – Components • Ground-Level Ozone (O3) • Effects • 2010 – 35% of US population lived in counties with ozone levels above EPA standards • Worst city = Los Angeles • Health • Respiratory inflammation • Reduction of lung function • Chest pain, coughing, nausea, pulmonary congestion • Permanent lung damage from repeated exposure
Air Pollution – Components • Ground-Level Ozone (O3) • Effects • 2010 – 35% of US population lived in counties with ozone levels above EPA standards • Worst city = Los Angeles • Health • Respiratory inflammation • Reduction of lung function • Chest pain, coughing, nausea, pulmonary congestion • Permanent lung damage from repeated exposure • Environment • Impair plant growth • Damage plant foliage • Ozone causes several billion dollars in agricultural crop loss each year • Damage to forest ecosystems
Air Pollution – Components • Sulfur Oxides (SOx) • Mostly SO2 but some SO3 • Reactive gases • Important in the formation of photochemical smog and acid rain • Sources • Formed when fuel containing sulfur (mainly coal and oil) is burned • Electricity generation (84%) • Metal smelting (3%) • Paper manufacturing • Other industrial processes (9% total)
Air Pollution – Components • Sulfur Oxides (SOx) • Effects • Major precursor to PM2.5 • Combine with water to form sulfuric acid • Major component of acid rain • Health • Temporary breathing impairment • Respiratory illness • Aggravation of cardiovascular disease • Especially harmful to elderly and children • Environment • Damage to structures and objects • Leaching of minerals from soil • Damage to plants/foliage • Acidification of lakes and waterways
SO2 1990-2010: SO2 emissions down 65%
Air Pollution – Components • Lead (Pb) • Sources • Formerly motor vehicles • Transition to unleaded gasoline virtually eliminated this source • Industrial plants • Smelters • Battery manufacturers • Human exposure mostly through inhalation of lead in air and dust • Food • Paint • Water