Download
1 / 20
200 likes | 226 Views
This study focuses on a geostatistical framework to manage water quality from private wells in Gaston County, analyzing potential threats and offering solutions. The project aims to assess contaminants, delineate risk areas, and enhance risk communication to improve awareness and testing practices.

E N D
Department of Health & Human Services A Geostatistical Framework to Support the Management of Water Quality from Private Wells Presenter Claudio Owusu July 10, 2019
Collaboration Team UNCC, Department of Geography and Earth Sciences and Center for Applied Geographic Information Science Eric Delmelle , Ph.D Wenwu Tang, Ph.D Yu Lan UNCC, Department of Public Health Sciences Gary Silverman, PhD (retired) Gaston County Department of Health & Human Services, Gastonia, NC Samantha Dye Alicia LaLoggia
Background • 13 million households rely on unregulated private wells for drinking water. • In NC, new private well owners are required to test for chemical and bacterial contamination in water before a permit is issued. • No further testing is required. • Studies show low routine water • testing of contaminants. • Chronic exposure to contaminants. • Severe health effects • Lead to death Source: https://www.epa.gov/privatewells/potential-well-water-contaminants-and-their-impacts
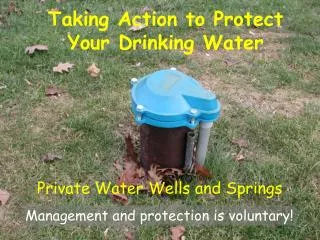
Study Area – Gaston County • 8,000+ unregulated private wells. • 42% of homes or 88,673 residents served by private wells.
Potential threats to groundwater in Gaston County • Leaching - two coal ash ponds at the eastern part of the county. • Discharges from industries located along the Catawba River which recharges most aquifers. • Older wells reaching the end of their functional capacity. • Naturally occurring arsenic in the western part of the county. • Leaks from underground storage tanks of petroleum products.
Management of Water Quality from Private Wells • Some Challenges • Lack of a digital geographic data of private wells • Hinders spatial exposure assessments • Setting up early warning alerts to well users in hazard zones • Low routine testing • Difficult to ascertain current state of water quality • Hypothesis • Geocoding techniques can be used to obtain the digital geographic data of private wells (Already addressed - Healthy Wells project) • Kriging estimates from historical water test results can be used to delineate areas with high probability of water quality concerns and identify private wells in need of targeted testing.
Objective • Develop a geostatistical framework to assess water contaminants from private wells in Gaston County and delineate risk areas of groundwater quality issues. • Provide a baseline study to help in setting-up sentinel wells to monitor groundwater quality across the county. • Aid risk communication of potential contaminations in hazard zones to increase awareness on frequent testing.
Geostatistics - Kriging • Kriging- an interpolation technique used to estimate values of unsampled locations using samples measured from known locations. • Indicator kriging (IK) - technique applied to nominal data (presence or absence) or data that are more easily treated if converted to a nominal scale. • Where zk is the regulatory threshold (MCL) for the specific contaminant. Z(u) is the spatial variable • IK Outcome- The probability of exceeding a specific threshold.
Workflow MCL = Maximum Contaminant Level
Results 1,238 samples was reported from 1082 unique private wells
Contaminants Examined Lead • Arsenic • Skin damage • Problems with circulatory systems • Increase risk of getting cancer • Lead • Kidney problems • High blood pressure • Delays in physical or mental development of children Arsenic
Model Fitting of Semivariogram Arsenic – (Gaussian Model) Nugget = 0.016 Sill = 0.013 Range = 3014 SSER =6.449373e-08 Lead – (Exponential Model) Nugget = 0.016 Sill = 0.05 Range = 4000 SSER = 2.147722e-07
Arsenic Cell Size =419.4m X 270.4m
Lead Cell Size =419.4m X 270.4m
Delineated Risk Areas and Affected Wells Probability of exceeding MCL > 0.5
Conclusions • Indicator kriging enable delineation of areas with high probability of exceeding MCL and locating wells that may need early warning. • Place-based interventions for specific contaminants with high probability of exceeding threshold could be effective amidst limited resources. • Further investigations is needed to determine factors that contribute to high probability of Arsenic (As) in Cherryville, and Lead (Pb) in Gastonia. • Results are currently been used as a baseline to optimize sentinel wells to help monitor groundwater quality across the county.
Thanks to our project sponsors • National Center for Environmental Health, Centers for Disease Control and Prevention. • Environmental Health Services Support for Public Health Drinking Water Programs to Reduce Drinking Water Exposures. CDC-RFA-EH15-1507 • Gaston County Department of Health & Human Services
Questions & Comments Claudio Owusu cowusu@uncc.edu
Further Studies Will Account for Factors Contaminant Source CONTAMINATION Private-well Absence of Treatment System installed/ Improperly Maintained