Download
1 / 3
30 likes | 102 Views
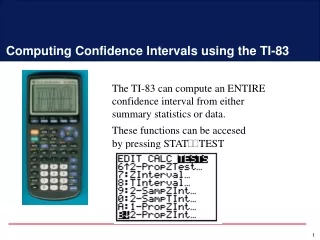
Learn how to use your calculator for statistics: input data, calculate mean, standard deviation. Follow easy steps for accurate results.

E N D
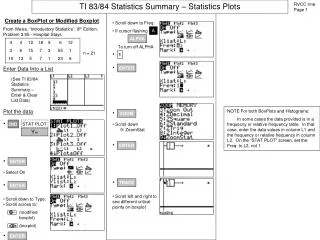
Using the TI-83Plus for Statistics Procedure
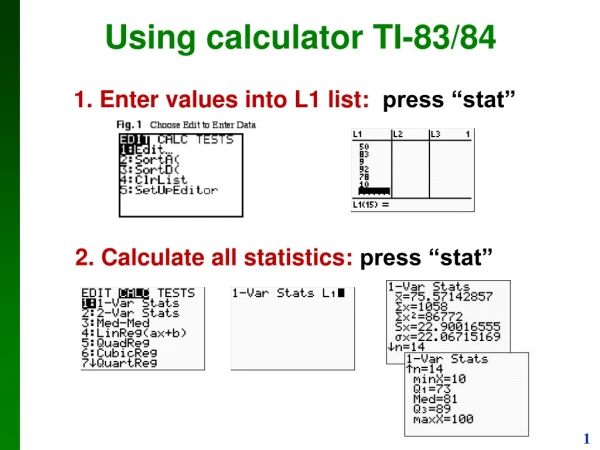
Using the calculator to find statistics on data: Step by step: • Press the "STAT" button. • With "EDIT" highlighted select "1:Edit" by pressing "ENTER". • If there is data in List 1 (L1) clear it by using the up arrow to highlight "L1". Then press "CLEAR" and "ENTER". • Enter your data into List 1 (L1) by entering each value and pressing "ENTER" after each value. • Press the buttons "2nd" and "MODE" (QUIT) to signify the end of the data. • Press the "STAT" button. • Use the right arrow to highlight the "CALC" selection. • Choose "1:1-Var Stats" by pressing "ENTER". • Press "ENTER" again. • Use the down arrow to scroll the remaining statistics on the screen. The mean uses the symbol x. • Press "CLEAR" to clear the screen.
Using the calculator to find the standard deviation: Step by step: • Press the "STAT" button. • With "EDIT" highlighted select "1:Edit" by pressing "ENTER". • If there is data in List 1 (L1) clear it by using the up arrow to highlight "L1". Then press "CLEAR" and "ENTER". • Enter your data into List 1 (L1) by entering each value and pressing "ENTER" after each value. • Press the buttons "2nd" and "MODE" (QUIT) to signify the end of the data. • Press the "STAT" button. • Use the right arrow to highlight the "CALC" selection. • Choose "1:1-Var Stats" by pressing "ENTER". • Press "ENTER" again. • Use the down arrow to scroll the remaining statistics on the screen. The standard deviation uses the symbol sx for sample, sx for population std.dev. • Press "CLEAR" to clear the screen.