Download
1 / 87
880 likes | 1.07k Views
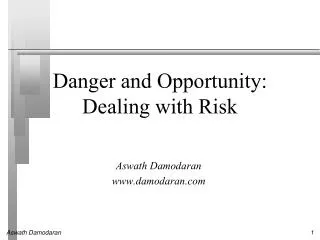
Danger and Opportunity: Dealing with Risk. Aswath Damodaran www.damodaran.com. Here is a good definition of risk….

E N D
Danger and Opportunity: Dealing with Risk Aswath Damodaran www.damodaran.com
Here is a good definition of risk… • Risk, in traditional terms, is viewed as a ‘negative’. Webster’s dictionary, for instance, defines risk as “exposing to danger or hazard”. The Chinese symbols for crisis, reproduced below, give a much better description of risk. • The first symbol is the symbol for “danger”, while the second is the symbol for “opportunity”, making risk a mix of danger and opportunity.
A good risk and return model should… 1. It should come up with a measure of risk that applies to all assets and not be asset-specific. 2. It should clearly delineate what types of risk are rewarded and what are not, and provide a rationale for the delineation. 3. It should come up with standardized risk measures, i.e., an investor presented with a risk measure for an individual asset should be able to draw conclusions about whether the asset is above-average or below-average risk. 4. It should translate the measure of risk into a rate of return that the investor should demand as compensation for bearing the risk. 5. It should work well not only at explaining past returns, but also in predicting future expected returns.
The Capital Asset Pricing Model • Uses variance of actual returns around an expected return as a measure of risk. • Specifies that a portion of variance can be diversified away, and that is only the non-diversifiable portion that is rewarded. • Measures the non-diversifiable risk with beta, which is standardized around one. • Translates beta into expected return - Expected Return = Riskfree rate + Beta * Risk Premium • Works as well as the next best alternative in most cases.
The Mean-Variance Framework • The variance on any investment measures the disparity between actual and expected returns. Low Variance Investment High Variance Investment Expected Return
The Effects of Diversification • Firm-specific risk can be reduced, if not eliminated, by increasing the number of investments in your portfolio (i.e., by being diversified). Market-wide risk cannot. This can be justified on either economic or statistical grounds. • On economic grounds, diversifying and holding a larger portfolio eliminates firm-specific risk for two reasons- (a) Each investment is a much smaller percentage of the portfolio, muting the effect (positive or negative) on the overall portfolio. (b) Firm-specific actions can be either positive or negative. In a large portfolio, it is argued, these effects will average out to zero. (For every firm, where something bad happens, there will be some other firm, where something good happens.)
A Statistical Proof that Diversification works… An example with two stocks..
A caveat on diversification: The lessons of 2008 • Diversification reduces exposure to risks that are uncorrelated. It cannot eliminate your exposure to correlated risks. • Two phenomena are undercutting the effectiveness of diversification: • Globalization: As companies and investors globalize, the correlation across global economies and markets is increasing. The benefits to diversification are therefore dropping. • Securitization: As more and more asset classes become securitized (accounts receivable, mortgages, commodities…), the correlation across asset classes is increasing. • When there is a crisis of confidence and investors become more risk averse, the correlation across all risky assets increases, thus undercutting the benefits of diversification when you need it the most.
The Role of the Marginal Investor • The marginal investor in a firm is the investor who is most likely to be the buyer or seller on the next trade and to influence the stock price. • Generally speaking, the marginal investor in a stock has to own a lot of stock and also trade a lot. • Since trading is required, the largest investor may not be the marginal investor, especially if he or she is a founder/manager of the firm (Michael Dell at Dell Computers or Bill Gates at Microsoft) • In all risk and return models in finance, we assume that the marginal investor is well diversified.
The Market Portfolio • Assuming diversification costs nothing (in terms of transactions costs), and that all assets can be traded, the limit of diversification is to hold a portfolio of every single asset in the economy (in proportion to market value). This portfolio is called the market portfolio. • Individual investors will adjust for risk, by adjusting their allocations to this market portfolio and a riskless asset (such as a T-Bill) Preferred risk level Allocation decision No risk 100% in T-Bills Some risk 50% in T-Bills; 50% in Market Portfolio; A little more risk 25% in T-Bills; 75% in Market Portfolio Even more risk 100% in Market Portfolio A risk hog.. Borrow money; Invest in market portfolio • Every investor holds some combination of the risk free asset and the market portfolio.
The Risk of an Individual Asset • The risk of any asset is the risk that it adds to the market portfolio Statistically, this risk can be measured by how much an asset moves with the market (called the covariance) • Beta is a standardized measure of this covariance, obtained by dividing the covariance of any asset with the market by the variance of the market. It is a measure of the non-diversifiable risk for any asset can be measured by the covariance of its returns with returns on a market index, which is defined to be the asset's beta. • The required return on an investment will be a linear function of its beta: Expected Return = Riskfree Rate+ Beta * (Expected Return on the Market Portfolio - Riskfree Rate)
Limitations of the CAPM 1. The model makes unrealistic assumptions 2. The parameters of the model cannot be estimated precisely - Definition of a market index - Firm may have changed during the 'estimation' period' 3. The model does not work well - If the model is right, there should be a linear relationship between returns and betas the only variable that should explain returns is betas - The reality is that the relationship between betas and returns is weak Other variables (size, price/book value) seem to explain differences in returns better.
Why the CAPM persists… • The CAPM, notwithstanding its many critics and limitations, has survived as the default model for risk in equity valuation and corporate finance. The alternative models that have been presented as better models (APM, Multifactor model..) have made inroads in performance evaluation but not in prospective analysis because: • The alternative models (which are richer) do a much better job than the CAPM in explaining past return, but their effectiveness drops off when it comes to estimating expected future returns (because the models tend to shift and change). • The alternative models are more complicated and require more information than the CAPM. • For most companies, the expected returns you get with the the alternative models is not different enough to be worth the extra trouble of estimating four additional betas.
Ways of dealing with risk in analysis • Risk Adjusted Value • Estimate expected cash flows and adjust the discount rate for risk • Use certainty equivalent cash flows and use the riskfree rate as the discount rate • Hybrid approaches • Probabilistic Approaches • Sensitivity Analysis • Decision Trees • Simulations • Value at Risk (VAR) and variants • Real Options
I. Risk Adjusted Value • The value of a risky asset can be estimated by discounting the expected cash flows on the asset over its life at a risk-adjusted discount rate: where the asset has a n-year life, E(CFt) is the expected cash flow in period t and r is a discount rate that reflects the risk of the cash flows. • Alternatively, we can replace the expected cash flows with the guaranteed cash flows we would have accepted as an alternative (certainty equivalents) and discount these at the riskfree rate: where CE(CFt) is the certainty equivalent of E(CFt) and rf is the riskfree rate.
a. Risk Adjusted Discount Rates Step 1: Estimate the expected cash flows from a project/asset/business. If there is risk in the asset, this will require use to consider/estimate cash flows under different scenarios, attach probabilities to these scenarios and estimate an expected value across scenarios. In most cases, though, it takes the form of a base case set of estimates that capture the range of possible outcomes. Step 2: Estimate a risk-adjusted discount rate. While there are a number of details that go into this estimate, you can think of a risk-adjusted discount rate as composed of two components Risk adjusted rate = Riskfree Rate + Risk Premium Step 3: Take the present value of the cash flows at the risk adjusted discount rate.
i. A Riskfree Rate • On a riskfree asset, the actual return is equal to the expected return. Therefore, there is no variance around the expected return. • For an investment to be riskfree, then, it has to have • No default risk • No reinvestment risk • Time horizon matters: Thus, the riskfree rates in valuation will depend upon when the cash flow is expected to occur and will vary across time. • Not all government securities are riskfree: Some governments face default risk and the rates on bonds issued by them will not be riskfree.
Betas don’t come from regressions: The determinants of betas
One solution: Estimate sector (bottom up) betas • The beta for a company measures its exposure to macro economic risk and should reflect: • The products and services it provides (and how discretionary they are) • The fixed cost structure (higher fixed costs -> higher betas) • The financial leverage (higher D/E ratio -> higher betas) • For Grana Y Montero: Levered Beta = 0.81 (1+ (1-.30) (433/2400)) = 0.92 Proposition: When a firm is in multiple businesses with differing risk profiles, it should have different hurdle rates for each business. .
Disney’s bottom up beta • Estimate the bottom up unlevered beta for Disney’s operating assets. Step 1: Start with Disney’s revenues by business. Step 2: Estimate the value as a multiple of revenues by looking at what the market value of publicly traded firms in each business is, relative to revenues. EV/Sales = Step 3: Multiply the revenues in step 1 by the industry average multiple in step 2. • Disney has a cash balance of $3,795 million. If we wanted a beta for all of Disney’s assets (and not just the operating assets), we would compute a weighted average:
Disney’s Cost of Equity • Step 1: Allocate debt across businesses • Step 2: Compute levered betas and costs of equity for Disney’s operating businesses. • Step 2a: Compute the cost of equity for all of Disney’s assets: Equity BetaDisney as company = 0.6885 (1 + (1 – 0.38)(0.3691)) = 0.8460 Riskfree Rate = 3.5% Risk Premium = 6%
iii. And equity risk premiums matter.. Historical premium
Additional country risk? • Even if we accept the proposition that an equity risk premium of about 4.5% is reasonable for a mature market, you would expect a larger risk premium when investing in an emerging market. • Consider Peru. There is clearly more risk investing in Peruvian equities than there is in investing in a mature market. To estimate the additional risk premium that should be charged, we follow a 3-step process: • Step 1: Obtain a measure of country risk for Peru. For instance, the sovereign rating for Peru is Baa3 and the default spread associated with that rating in early 2010 was 2%, • Step 2: Estimate how much riskier equities are, relative to bonds. The standard deviation in weekly returns over the last 2 years for Peruvian equities was 26% and the standard deviation in the bond was 13%. • Step 3: Additional risk premium for Peru = 2% ( 26/13 ) = 3% • Step 4: Total equity risk premium for Peru = 4.5%+3%=7.5%
Equity Risk Premiums January 2010
An example: Rio DisneyExpected Cash flow in US $ (in April 2009)
Rio Disney: Risk Adjusted Discount Rate • Since the cash flows were estimated in US dollars, the riskfree rate is the US treasury bond rate of 3.5% (at the time of the analysis. • The beta for the theme park business is 0.7829. This was estimated by looking at publicly traded theme park companies. • The risk premium is composed of two parts, a mature market premium of 6% and an additional risk premium of 3.95% for Brazil. Country risk premium for Brazil = 3.95% Cost of Equity in US$= 3.5% + 0.7829 (6%+3.95%) = 11.29% • Using this estimate of the cost of equity, we use Disney’s theme park debt ratio of 35.32% and its after-tax cost of debt of 3.72%, we can estimate the cost of capital for the project: Cost of Capital in US$ = 11.29% (0.6468) + 3.72% (0.3532) = 8.62%
Rio Disney: Risk Adjusted ValueRisk Adjusted Discount Rates Discounted at Rio Disney cost of capital of 8.62%
Does the currency matter? • The analysis was done in dollars. Would the conclusions have been any different if we had done the analysis in Brazilian Reais? • Yes • No
Disney Theme Park: $R NPV • Expected Exchange Ratet • = Exchange Rate today * (1.07/1.02)t Discount at $R cost of capital = (1.0862) (1.07/1.02) – 1 = 13.94% NPV = R$ 5,870/2.04= $ 2,877 Million NPV is equal to NPV in dollar terms
b. Certainty Equivalent • You are investing in a risky environmen, where your cash flow next year look as follows: • $100 million, with 80% probability • -$100 million, with 20% probability What is the expected cash flow? • How much would you accept as a guaranteed alternative to this investment? • $100 million • $ 60 million • More than $ 60 million • Less than $ 60 million
Computing Certainty Equivalent cash flows right… Step 1: Convert your expected cash flow to a certainty equivalent. There are three ways you can do this: a. Compute certainty equivalents, using utility functions (forget this) b. Convert your expected cash flow to a certainty equivalent c. Subjectively estimate a haircut to the expected cash flows Step 2: Discount the certainty equivalent cash flows at the riskfree rate.
Rio Disney: Risk Adjusted ValueCertainty Equivalent Cash flows CFt* 1.035t/1.0862t Discount at 3.5%
II. Probabilistic Approaches • The essence of risk that you are unclear about what the outcomes will be from an investment. In the risk adjusted cash flow approach, we make the adjustment by either raising discount rates or lowering cash flows. • In probabilistic approaches, we deal with uncertainty more explicitly by • Asking what if questions about key inputs and looking at the impact on value (Sensitivity Analysis) • Looking at the cash flows/value under different scenarios for the future (Scenario Analysis) • Using probability distributions for key inputs, rather than expected values, and computing value as a distribution as well (Simulations)
a. Sensitivity Analysis and What-if Questions… • The NPV, IRR and accounting returns for an investment will change as we change the values that we use for different variables. • One way of analyzing uncertainty is to check to see how sensitive the decision measure (NPV, IRR..) is to changes in key assumptions. While this has become easier and easier to do over time, there are caveats that we would offer. Caveat 1: When analyzing the effects of changing a variable, we often hold all else constant. In the real world, variables move together. Caveat 2: The objective in sensitivity analysis is that we make better decisions, not churn out more tables and numbers. Corollary 1: Less is more. Not everything is worth varying… Corollary 2: A picture is worth a thousand numbers (and tables).
What if the cost of capital for Rio Disney were different (from 8.62%)?
b. Scenario Analysis • Scenario analysis is best employed when the outcomes of a project are a function of the macro economic environment and/or competitive responses. • As an example, assume that Boeing is considering the introduction of a new large capacity airplane, capable of carrying 650 passengers, called the Super Jumbo, to replace the Boeing 747. The cash flows will depend upon two major “uncontrollable” factors: • The growth in the long-haul, international market, relative to the domestic market. Arguably, a strong Asian economy will play a significant role in fueling this growth, since a large proportion of it will have to come from an increase in flights from Europe and North America to Asia. • The likelihood that Airbus, Boeing’s primary competitor, will come out with a larger version of its largest capacity airplane, the A-300, over the period of the analysis.
The scenarios… Number of planes sold under each scenario (and probability of each scenario)