Download
1 / 22
220 likes | 367 Views
Current developments and future opportunities for the Global Ocean Carbon Observing Network. Christopher Sabine, Richard Feely, Rik Wanninkhof , Steve H ankin. Carbon Inventories of Reservoirs that Naturally Exchange Carbon on Time Scales of Decades to Centuries. Ocean C Ant =0.39%.

E N D
Current developments and future opportunities for the Global Ocean Carbon Observing Network Christopher Sabine, Richard Feely, RikWanninkhof, Steve Hankin
Carbon Inventories of Reservoirs that Naturally Exchange Carbon on Time Scales of Decades to Centuries Ocean CAnt =0.39% Soil=2800 PgC (Ocean Cant < 1.5% of upper 1000 m) Preind. Atm. C =74% Plants=750 PgC Atm.=795 PgC CAnt. = 26% Ocean 38,148 PgC • Oceans contain ~90% of carbon in this 4 component system • anthropogenic component is difficult to detect
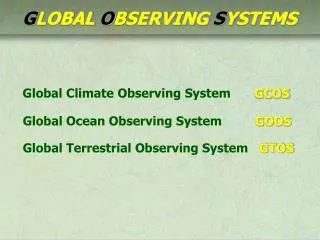
OceanObs’09: Vision Provision of routine and sustained global information on the marine environment sufficient to meet society’s needs for describing, understanding and forecasting marine variability (including physical, biogeochemical, ecosystems and living marine resources), weather, seasonal to decadal climate variability, climate change, sustainable management of living marine resources, and assessment of longer term trends
Global Ocean Carbon Network is made up of four OCO projects that address two of the GCOS essential climate variables: • surface ocean CO2 • ocean interior carbon
Global Repeat Hydrographic/CO2 /Tracer surveys R. Feely, C.L. Sabine, G. Johnson, J. Bullister, C. Mordy (PMEL); R. Wanninkhof, M. Baringer, J. Zhang (AOML); C. Langdon (RSMAS) To maintain decadal time-scale sampling of ocean transports and inventories of climatically significant parameters in support of the Ocean Carbon Monitoring Network of the Program Plan for Building a Sustained Observing Network for Climate. Goal: Approach: The Repeat Hydrography CO2/Tracer Program is a systematic and global re-occupation of select hydrographic sections to quantify changes in storage and transport of heat, fresh water, carbon dioxide (CO2), chlorofluorocarbon (CFC) tracers and related parameters to assess changes in the ocean’s biogeochemical cycle in response to natural and/or man-induced activity. Achievements: In FY 2011, NOAA and NSF co-sponsored two CLIVAR/ Repeat Hydrography cruises in the Pacific and Atlantic sectors of the Southern Ocean, S4P and A10. This April/May of this year we completed A20 and A22 in the North Atlantic.
FY2011 Global Repeat Hydrographic/CO2 /Tracer surveys 2011 Global map of International Repeat Hydrography CO2/Tracer Program hydrographic sections with carbon system that have been completed over the last decade. The U.S. cruises are designated with blue lines.
FY2011 Global Repeat Hydrographic/CO2 /Tracer surveys Sections of dissolved inorganic carbon along the S4P (top) and A10 (bottom) transects. Principal Investigators: R. Feely (NOAA/PMEL) R. Wanninkhof (NOAA/AOML)
An informal Community Survey on CLIVAR/CO2Repeat Hydrography Program Data Usage As of April 2012, 62 people had responded CTD Bottle Data Underway pCO2 ADCP Bathy- metry Meteor- ology Other Survey responders identified ~140 peer-reviewed journal articles published over the last 6 years based on the repeat hydrography data Trace Metals Carbon Nutrients Other Transient Tracers
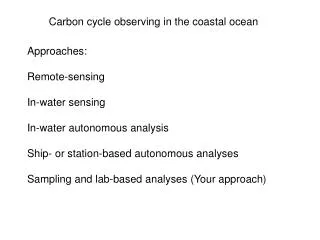
NOAA Surface pCO2 Measurement Program R. Wanninkhof, C.L. Sabine, R. Feely, T. Takahashi, S. Sutherland, N. Bates, F. Chavez, G. Goni, and F. Millero To quantify the daily to interannual variability in air-sea CO2 fluxes and understand the mechanisms controlling these fluxes. Goal: Make autonomous surface pCO2 measurements using research and volunteer observing ships (VOS) to get spatial coverage at seasonal time scales and using a network of surface moorings to get high frequency temporal resolution. Approach:
SST, fCO2 and CO2 flux in the Equatorial Pacific Large-Scale Observational Results: 1982-2009 • El Niño: 0.2 - 0.3 Pg C yr-1 • Non El Niño: 0.5 - 0.7 Pg C yr-1 • La Niña: 0.6 - 0.8 Pg C yr-1 • Average: 0.5 ± 0.2 Pg C yr-1 • 25-30% Increase in flux after the 1997-1998 El Niño Feely et al. (in preparation) Estimates utilize the gas transfer scaling factor of 0.24, For NCEP-DOE AMIP-II winds (after Takahashi et al, in 2009)
Interannual Variability in Sea-air CO2 Fluxes from Park et al., 2010, Tellus B
Graphical user interface of Sea-Air CO2 fluxes on monthly timescales ∆pCO2 data from CPO/COD CO2 on ships project and international collaborators, and empirical approach of Park et al. (2010) http://cwcgom.aoml.noaa.gov/erddap/griddap/aomlcarbonfluxes.graph Map of Sea-air CO2 fluxes for December, 2011
Temporal Changes in winds, fCO2, ∆fCO2 and CO2 Flux in the Equatorial Pacific The flux of CO2 from the equatorial Pacific has increased about 25-30% since 1998.
Moored pCO2 Program C.L. Sabine (PMEL), A.J. Sutton (PMEL), S. Jones (PMEL), S. Musielewicz (PMEL) and R. Bott (PMEL) Goal: To evaluate the temporal variability in air-sea CO2 fluxes by conducting high resolution time-series measurements of atmospheric boundary layer and surface ocean pCO2. Approach: Develop an inexpensive, robust, accurate pCO2 system that can be deployed on a variety of mooring and drifter configurations for up to a year at a time. Achievements: We are at 24% of array design with 7 systems on TAO array, 4 in the North Pacific (including Papa) and 1 in the South Pacific. www.pmel.noaa.gov/co2/story/Buoys+and+Autonomous+Systems
Moored pCO2 Program The value of time series lies in their continued data collection. The 7 year time series at the MOSEAN H-A/WHOTS mooring site shows an increasing trend in ocean and atmosphere CO2. Seasonal fluctuations are also apparent in both seawater and air (e.g., low seawater CO2 in the winter and high seawater CO2 in the summer).
Moored pCO2 Program Launched in February 2011, the PMEL Carbon Group website (www.pmel.noaa.gov/co2) is completely revised and enhanced The website received over 75,000 unique visits between Feb and the end of FY2011 New Google Earth data portal displays near real time data plots of air and seawater CO2 at all moorings, including the 12 OCO funded sites
Global Carbon Data Management and Synthesis Project C.L. Sabine, R. Feely, S. Hankin (PMEL); A. Kozyr (CDIAC)*; R. Wanninkhof (AOML); R. Key (PU); F. Millero (UM)*; A. Dickson (Scripps)* *no longer funded To make the global carbon observing network data readily available to the community and to use these data to better understand the role of the oceans in the global C cycle. Goal: Approach: Use repeat hydrography data to evaluate decadal changes in carbon inventories and the surface CO2 data to evaluate air-sea CO2 exchanges. Global CO2 data sets published; air-sea CO2 fluxes estimated from 1982-2009; Global anthropogenic CO2 storage estimated up through 2008. Achievements: Annual air-sea CO2 flux anomalies 1982–2009 2008 anthropogenic CO2 column inventory (mol m-2) Figures from Sabine et al. 2010 (BAMS, State of the Climate 2010)
Global Carbon Data Management and Synthesis Project http://socat.info Products include a 2nd-level quality controlled, global surface ocean fCO2data set with >6.3 million observations and gridded summary fields derived from the cruise data on a 1° x 1° grid with no temporal or spatial interpolation.
New synthesis efforts are greatly expanding the available data for examining carbon changes GLODAP ~ 100 cruises (1989-1998) (light gray) CARINA ~ 188 additional cruises (1976-2008) (dark gray) PACIFICA ~ 260 additional cruises (1985-2008) (medium gray)
Regional Carbon Cycle Assessment and Processes Ocean uptake and storage products are being incorporated into global carbon assessments, including the IPCC 5th Assessment Report
Summary of magnitude, variability and trends of Sea-air CO2 fluxes for RECCAP, (Regional carbon cycle assessment project) (Wanninkhof et al., 2012, in prep) Summary of the different modeling approaches. In case of the OGCMs and atmospheric inverses, the annual median value is plotted.