Download

1 / 25
250 likes | 356 Views
Using VFT and Optimization to Create the Acquisition Portfolio for the Marines Infantry Optics. MORSS June 2008. Background.

E N D
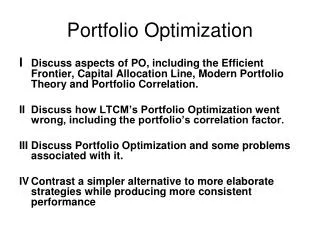
Using VFT and Optimization to Create the Acquisition Portfolio for the Marines Infantry Optics MORSS June 2008
Background • Since 2003 the USMC Program Manager for Optics has invested considerable resources to meet Urgent Universal Needs Statements from the Operating Forces for enhanced optics. Since the needs identified were urgent, there was not time to fully understand how these different systems would work together. • Bottom Line: How useful is our current optics portfolio, and what are some cost effective solutions to improve it? • Study Objectives: • Identify capability gaps and technological shortcomings of current and near-term optics systems, and • Provide recommendations and courses of action on a suite of systems to resolve those capability gaps and technological shortcomings.
Study Characterization • There are four “Buckets” of capability as defined by ICDs that are highly interrelated. • Hand Held, Helmet Mounted, Weapon Mounted, Crew Served • Capability value is dependent on one of five scenarios and who is using the system. • Value of a system is dependent on what others in the unit have. • Data: • Initial metrics had been determined but little data had been gathered against the alternatives. • Some testing had been done • A lot of system level data gaps • Like many situations where there was rapid fielding to meet urgent needs, there was no comprehensive knowledge of who had what equipment and what equipment was being used.
Accomplishments • Two levels of analysis • System Level Analysis: The analysis helped determine the “best” system within each role and usage, such as Infantryman Head-Mounted. • Portfolio Level Analysis: The analysis gave insight into portfolio level trades to ensure that the optics systems were treated as a family of systems. • Unique use of linear programming to ensure capability gaps were fulfilled and to address competing objectives.
Performance Initial Fundamental Objectives Hierarchy Functional Decompositions of Scenarios Task to Capability to Metric Secondary Performance Burden Function/ Environment
New Structure for Individual Optic Evaluation • Twenty-three R-U-S level paths • Example: Infantry Leader- Helmet Mounted - Scenario 1
Value Focused Thinking approach was taken for initial Individual Optic analysis • Example of Value Based Alternatives added • Integrated laser into optics: Already bore sited, one less optic, total is lighter weight • Mononcular with LRF: Lose depth percentage but gain active range finding, decreased weight and cost. • Good at evaluating individual systems • But from a Pf level, misses relationship between Roles and also between alternatives Alternative Development and System Applicability Swing for each measure was define (refined several times) Value Functions (refined several times) Swing Weight (One for each R-U-S) Evaluated the Alternatives (for each R-U-S) New Cost Benefit (Aggregated to R-U Level) Evaluated Cost Benefit (Aggregated to R-U Level) Identified New Value Based Alternatives
Evaluating the Family of Individual Optics study “Best” Day Sites • After we had confidence in the the Individual Optics (system level) analysis ...We moved to the Family of Systems Analysis. • Some system “types” were not selected because of cost but they provide capability. • We need to define Family (portfolio) level capability. • This is more difficult because they hadn’t been defined before. “Best” Thermal Site
Pf Level Issue 1: Relationship between Roles • Infantry Leader and Infantry can leverage capability. Leader has to have the same or greater capability --- Sometimes • Taking into account three factors should allow for MECE evaluation • Day • Night • Obscurants
Pf Level Issue 1: Relationship between Roles Examples of Leveraging and Satisfying Ldr: Can you ID that bad guy? Inf: Yes! Ldr: Okay, shoot him. Day Time/ XX Meters (No need to leverage) Ldr: Can you ID that bad guy? Inf: No. Ldr: I can, can you see my laser? Inf: Yes! Ldr: Okay, shoot him. Night Time/ XX Meters (Opportunity to leverage) Ldr: Can you ID that bad guy? Inf: No. Ldr: I can, can you see my laser? Inf: No. Ldr: Okay, I’ll shoot him. Obscurants / XX Meters Leverage is more difficult
Pf Level Issue 2: Relationship between Usage • Infantryman can use one (or more) device to accomplish a mission. • Helmet Mounted 1x I2 optic to maneuver at night (base capability) • They use a head mounted eyeball during the day • Plus an 4x I2 clip on to increase range and a 4x IR handheld to see through obscurants. • Downside: Greater range potential but more systems to worry about, more total weight • A 4x helmet mounted fused I2 plus IR optic to increase range and see through obscurants. • Downside: Fewer systems and less total weight BUT lower performance and more weight on your head All ounces are not equal
Pf Level Issue 3: Different Tasks for Different Roles • Leaders need to sense and detect, as well as Identify. • Infantrymen need to sense to maneuver but identify to engage
One Pf Level Solution Identify a Domain • Establish a Domain level required capability • Domains determined by how Marines fight. Capability for each Role and Usage: Completing a Task in a Condition to a Standard. The standard were defined as the value measures within the context of the Marines Role and how the optics would be used. Whether a capability was required (leverage or optional) was determined by the study team and verified by an operator panel
Domains allow for identifying building blocks within the Pf • This construct allows for identification of capability gaps.
Building blocks can be put together to identify Pf metrics • Unit of analysis is the Infantry Company with Heavy Machine Gun platoon. • It addresses the needs of the most demanding users and gives a basis for identifying Pf level metrics • Total Pf Value, Total Weight, Total Number of Systems (Human Factors), Total Number of Unique systems (sustainability measure) Some gaps like M203 site and M249 site hard coded, since the solution is already known. Putting the Building blocks together will get 90% there
So how do you solve the problem? • Linear Program • 70 Alternative • 119 Decision Variables • 27 Constraints • Up to Four Objective Functions • VBA Macro was used to 4 Pf level metrics 70 Alternatives 23 Scenarios 4 Domains 2 Functions 3 Environments
Optimization Runs • Many calibration runs were conducted to refine the model structure and determine trade space. • Optimization was run in a batch of 360 runs. • Cost for Unit of Analysis constrained was varied from $750k to $8m, but increments of $250k, • Number of unique systems to outfit unit of Analysis was varied from 16 to 25. • Subsequent runs were conducted to determine the Pf that fullfilled all the capabilities at lowest cost. • Current systems (Pf 2007) and Status Quo (Pf 2010, if not changes to procurement plan were made) were also added. • Overall analysis looked at 363 separate Pfs. • Model recorded Pf compositions, Value Score, Cost, Risk, Total Weight, Total Unique Systems and whether it passed all the constraints.
Optimization Output • Initial output was messy to display and difficult to interpret. • The data were stratified to lend some clarity.
Objective 1: Maximize Benefit Pf Results by Objective: Objective 2 and 3: Fewest Systems and Minimize weight Yellow line = Pf with 17 Systems. This is the fewest number that fulfils all capabilities Management Objective: Lowest Cost 2007 and 2010 Pfs: Note: both on the line of efficient frontier Note: Significant increase from 2007 to 2010
Risk Analysis • As risk index was developed for each Pf. This number used a linear scale assigned to level of maturity. These numbers were summed within a Pf to gain a indication of relative risk. Risk was treated as a dependent variable, thus was never a binding constraint within the Pf optimization. • In general, as Pf increased in effectiveness they was also an increased in risk, however within each circle there was not a linear relationship.
Sensitivity Analysis • Two Types of Cost Sensitivity were complete • Sensitivity with respect to technology maturity • Sensitivity with respect to sunk cost • Pf that are on the LOEF are sensitivity to either sunk cost or technology maturity depending on their placement on the curve. • Pfs that achieve capabilities with fewer number of systems (right hand graph) are not sensitive to both technology maturity and sunk cost.
Lessons Learned and Areas of Further Study • Process needed to be iterative • Draft results, take them all the way through, check, iterate. • Many calibration runs were conducted. First time through was always wrong. • Pf Level Capabilities • System level objectives and capabilities were determined early • Pf level objectives were determined early, but not the capabilities • Stakeholder involvement essential • PM, Tech, Cost, DA, operator; all brought something to the table • Vary Pfs from the Points on Interest. • Further trades could be made from run of 363 Pfs
0 2 4 6 8 10 12 14 Wavelength (microns) LWIR DAY OPTICS MWIR Notional I2 Extended Wavelength I2 Technology SWIR LOW RESOLUTION HIGH DETECT TARGETING IDENTIFY Uncooled Quantum Detectors (solid state detector) Capability NIR VIS Laser Pointer 0.68 um Eyesafe Cooled Quantum Detectors (solid state detector) Notional Laser Pointer/Illuminator 1.5 um Eyesafe Laser Pointer/ Illuminator 0.98 um Not Eyesafe Uncooled Microbolometers (Cooled Quantum Detector - obsolete) Little to no adversary coverage with man-portable gear Virtually no adversary coverage with man-portable gear Wide adversary coverage Enemy Availability Obscurants Weak Thermal Coverage “Black” on moonless, overcast night Image from “Sky Glow” Always Available (day/night) Poor Visibility in Smoke / Fog / Dust / Rain / Snow Some Visibility Smoke / Fog / Dust / Rain / Snow Smoke / Dust - Some Visibility Rain - Occasional Visibility Snow - Poor Visibility