Download
1 / 33
2.12k likes | 6.18k Views
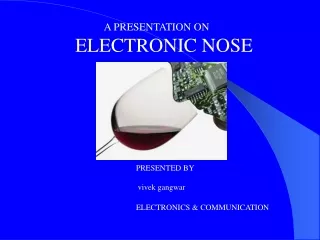
Electronic Nose. Presentation by: Ameer Iqbal Roll No.- 10 EE 64 R 02 M.Tech . (Instrumentation). Contents. Introduction Components Sensors Pattern recognition Wireless electronic nose Advantages & limitations Applications

E N D
Electronic Nose Presentation by: Ameer Iqbal Roll No.- 10EE64R02 M.Tech. (Instrumentation)
Contents • Introduction • Components • Sensors • Pattern recognition • Wireless electronic nose • Advantages & limitations • Applications • Future & conclusion
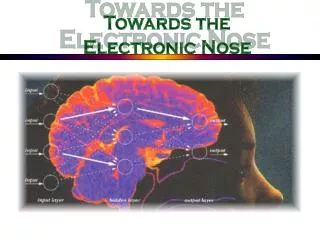
Biological Nose • Detection and identification of odour • Quantifying smells are useful in gas chromatography • Human nose is very sensitive • Subject to fatigue, inconsistencies, adaptation etc. • Smelling toxic gases may involve risk Fig. Conduction route diagram of animal olfactory system
Electronic Nose • Instrument intended to mimic the human sense of smell • Combines human sensitivity & instrument’s objective • Consists of: • Sample handling system • Sensing system • Pattern recognition system Fig. Schematic diagram of an electronic nose
Electronic Nose • Correspondence of electronic nose with biological nose
Components • Sample handling system • Generates the headspace of sample to be analyzed • Exposes the odorant to the sensors • Sensing system • Array of different sensors • Each sensor has different sensitivity to different gases • Produces a pattern characteristic of the odour Fig. Response of sensor array to different pure chemicals
Sensing system • Quantity & complexity of the data collected can make analysis of data in an automated system difficult. • Using array of sensors, each sensor designed to respond to a specific chemical • Number of unique sensors must be at least as great as the number of chemicals being monitored • Difficult to build highly selective chemical sensors • Expensive also
Sensing system • Use of Artificial neural networks (ANN) • ANN combined with a sensor array • Number of detectable chemicals is greater than that of sensors • Less selective sensors can be used • Less expensive too • Electronic noses incorporating ANNs have been demonstrated in various applications.
Electronic nose sensors • Conductivity Sensors (a) Metal Oxide Sensor • Oxides of tin, zinc, titanium etc. doped with platinum – Active material • Doped material deposited between two metal contacts over a resistive heating element • Operating temp.: 200°C-400°C • As VOC passes over the active material, resistance changes • Resistance changes in proportion to the concentration of the VOC.
Conductivity Sensors (b) Polymer Sensor • Active material is a conducting polymer • e.g. Polypyroles , thiophenes , indoles etc • When exposed, chemicals forms bond with polymers • Bonding may be ionic or covalent • Transfer of electrons along polymer chain is affected, i.e. conductivity changes • Operate at ambient temperature, no heater required
Conductivity Sensors Fig. Comparison between metal oxide & polymer sensors
Piezoelectric Sensors (a) Quartz crystal microbalance (QCM) • Consists of a resonating disk with metal electrodes on each side connected to lead wire • Resonates at a characteristic frequency (10-30 MHz) when excited with an oscillating signal • Polymer coating serves as sensing material • Gas adsorbed at the surface of the polymer increases the mass, reduces resonance frequency • Reduction is inversely proportional to mass adsorbed by the polymer
Piezoelectric Sensors (b) Surface acoustic-wave (SAW) • An ac signal is applied across the input metal transducer • Fingers of this gas sensor creates an acoustic wave that "surfs" the piezoelectric substrate • When the wave reaches the metal fingers of the output transducer, ac voltage is recreated • Voltage is shifted in phase as a result of the distance travelled. • Phase shift depends on the mass & the absorption properties of the sensing polymer layer • SAW devices are less sensitive than QCMs
Piezoelectric Sensors • Limitations: • More complex electronics are needed by these sensors than conductivity ones • Resonant frequencies can drift due to the active membrane ageing • Requires frequency detectors
MOSFET Sensors • Gate is covered by noble metal catalyst, e.g. platinum, palladium, or iridium • Charge applied to the gate leads to current flow from source to drain • VOCs sweeping over the catalyst forms products that alter the sensor's gate charge • Channel conductivity varies
MOSFET Sensors • Advantage: • Can be made with IC fabrication processes, batch to batch variation is minimized • Disadvantage : • Reaction products should penetrate the catalytic metal layer in order to influence the charge • Hermetic seal for the chip’s electrical connections in harsh environments
Optical Sensors • Glass fibre coated on its sides & ends with a thin active material containing fluorescent dyes • Pulse of light from an external source propagates along the fibre • VOCs can alter the polarity of the dyes • Dyes responds by shifting fluorescent spectrum of the light • Simple fabrication- Fluorescent dyes can easily be coupled
Signal processing & pattern recognition • Main sequential steps: • Pre-processing • Feature extraction • Classification and • Decision making • Data base of the expected odorant should be compiled
Signal processing & pattern recognition • Pre-processing • Compensates for sensor drift • Compress the transient response of the sensor array • Reduces sample to sample variations • Feature extraction • Reduce the dimensionality of the measurement space • Can be more readily inspected visually • Extract information relevant for pattern recognition • Performed with linear transformations e.g. PCA & LDA • Nonlinear transforms, e.g. Sammonnonlinear maps and Kohonen self organizing maps
Signal processing & pattern recognition • Classification • Bayesian classifiers, Artificial Neural Network(ANN) etc are used • Trained to identify the patterns that are representative of each odour • Identify the odorant by comparing it with trained ones • Decision Making • Used for application specific knowledge • Can determine that given sample does not belong to any one in database
Wireless Electronic Nose • Developed in 2010 • Can perform remote multipoint odour monitoring • Signal from isolated locations can be combined and processed at a database server • Data measured are delivered via ZigBee wireless network Fig. ZigBee node of wireless electronic nose network.
Wireless Electronic Nose (a)Electronic Hardware • MCU acquires gas sensor data through ADC interface & sends the data to ZigBee wireless network • Real time clock in MCU stamps date and time of the transmitted data Fig. Block diagram of wireless electronics nose.
Wireless Electronic Nose • Sensors were designed to be particularly sensitive to different gases • Temp. & humidity sensors for environmental conditions. Table- Sensors used for the developed electronic nose
Wireless Electronic Nose (b)Gas Flow System • Two solenoid valves control the flow of reference air & air sample • Reference air - air filtered by activated carbon (valve 1) • Valve 1 open- valve 1 closed-valve 2 open- valve 2 closed Fig. Gas Flow System
Wireless Electronic Nose (c) Principal Component Analysis (PCA) • Data from ADC is stored in 2-D array versus sampling time • Data for each sensor are subtracted by their mean values • Covariance matrix of the subtracted data is computed • Eigenvectors & Eigenvaluesof the covariance matrix are then calculated • Then principal components are chosen and featuring vectors are formed
Wireless Electronic Nose (d) ZigBee Technology • ZigBeeis famous for its low cost, low power consumption & miniaturization • Tree topology, with benefits of star & mesh, was used • Mostly operates in sleep mode, low power consumption • End nodes acquire e-nose data and send them to the router nodes • Router nodes combines its own data & send to base nodes • Data was sent to database server Fig. Tree Topology
Wireless Electronic Nose Fig. Normalized data set from wireless electronic nose. Fig. PCA plot between PC1 &PC2
Electronic Nose • Advantages • Detection of poisonous gas is possible • Can be done in real time for long periods • Cheaper than Trained human sniffers • Individuals vary, e-nose don’t • Limitations • Time delay between successive tests • Insensitivity to some species • According to application, e-nose has to be changed
Applications • Environmental control (air quality, gas emission levels of factories, chemical plant monitoring etc.) • Medical applications (urine, skin, breathe odour analysis, ulcer monitoring etc) • Food industry (coffee, fermentation process, identification of bacteria etc.) • Defence and security industries (detecting land mines) • Pharmaceutics, chemical industry (odour, quality control of pharmaceutical compounds etc.) • Semiconductor industrial process
Future Work • Research is being done on IC E-Noses • Miniaturizing current Technology • Improvement in sensitivity for lower levels of organisms or smaller samples • Minimizing cost
Conclusion • Humans are not well suited for repetitive tasks. Electronic nose has the potential to become standard tool for smelling. Researches are still going on to make electronic nose much more compact than the present one and to make e-nose ICs.
References [1] T.Pogfay, N.Watthanawisuth, W.Pimpao, A.Wisitsoraat, S. Mongpraneet, T.Lomas & M.Sangworasil: “Development of Wireless Electronic Nose for Environment Quality Classification”, International conference 0n Electrical Engineering/Electronics, Computer, Telecommunications and Information technology, 19-21 May, 2010 [2] S.H. Saeed, Z. Abbas, B. Gopal: “Experimental use of electronic nose for analysis of volatile organic compound”, Multimedia, Signal Processing and Communication Technologies, 2009. IMPACT '09, 14-16 March 2009 [3]Nagle H T, Gutierrez-Osuna R, Schiffman: “The how and why of electronic nose”, IEEE Spectrum, Sep 1998 [4] Lars J. Kangas, Lars H. Liden, SherifHashem, Richard T. Kouzes: “Electronic noses & their applications”, IEEE Technical ApplicationsConferenceand Workshops, 1995 [5] http://en.wikipedia.org/wiki/Electronic_nose