Download
1 / 9
90 likes | 300 Views
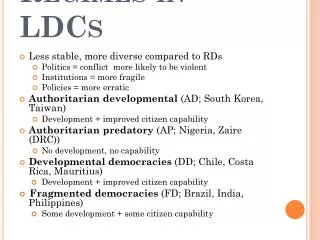
Distribution of LDCs and MDCs. Regions. There are 9 geographical regions. 2 are considered more development: North America and Europe. Latin America, East Asia, Central Asia, West Asia, Sub-Saharan Africa, South Asia are all less developed. Reflects a global pattern.

E N D
Regions • There are 9 geographical regions. • 2 are considered more development: North America and Europe. • Latin America, East Asia, Central Asia, West Asia, Sub-Saharan Africa, South Asia are all less developed. • Reflects a global pattern.
North America: 0.95 • 2009: Ranked 13th • Near the top for GDP and literacy rate • Lower in education and life expectancy. • What factors contribute to this? • N.A. highest percentage of tertiary sector employees. • World’s leading food exporter.
Europe 0.93 • Elimination of economic barriers has made it the largest and richest market. • Highest areas: western Germany, northeastern France, northern Italy, Switzerland, southern Scandanavia, southeastern U.K., Belgium, Netherlands, Luxembourg. • Southern and Eastern Europe are what brings the HDI of Europe below that of North America.
Russia 0.73 • Communism caused economic instability and a sharp decline in HDI. • In 2000 they experienced economic growth fueled by production of oil.
Japan 0.96 • A 3rd area of high HDI despite having a high ratio of population to resources. • Asset: high number of people willing to work hard for low wages. • Gained their foothold in the world economy selling low cost products, they began manufacturing high quality, high value products.
Oceania 0.90 • Have access to important minerals and food. • Their economies are tied to Japan and other Asian countries.