Download
1 / 3
30 likes | 143 Views
Learn about positive, negative, and no correlation on graphs and how to identify the Line of Best Fit on scatter plots. Enhance your math skills with clear examples and explanations.

E N D
Correlation and Line of Best Fit Maths HL By Joseph Harley 9G
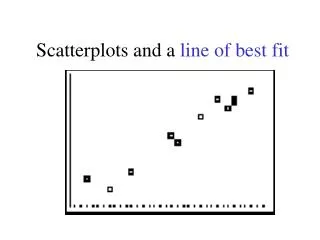
Correlation If the points on a graph increase in value on the Y axis as they go along the X axis, then a graph has ‘positive correlation’, like the one shown top left. If the points decrease in value on the Y axis as they go along the X axis then a graph has ‘negative correlation’(see bottom left). If there is no pattern then the graph has ‘no correlation’(see bottom right).
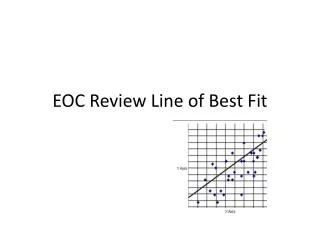
Line of Best Fit The Line of Best Fit is a line drawn on a scatter graph that goes through the maximum number of points. Therefore the Line of Best Fit on the graph on this slide is: