Download
1 / 7
70 likes | 233 Views
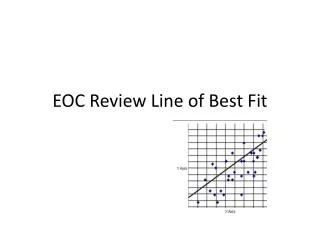
EOC Review Line of Best Fit. Lesson Goals . I can plot data on a scatter plot. I can calculate the line of best fit . Lines of Best Fit . When mathematical models are used in the real world, we often don’t have data that fall on perfect lines.

E N D
Lesson Goals • I can plot data on a scatter plot. • I can calculate the line of best fit
Lines of Best Fit • When mathematical models are used in the real world, we often don’t have data that fall on perfect lines. • Most of the time we want to find the line of best fit (or the line that best fits the data).
Exercise 1 (a) On the grid provided, create a scatterplot of the data. Use the diameter as the independent variable and the height as the dependent variable. (b) Draw a line of best fit through the data. As a guide, try to have as many points of data fall above the line as below the line. (c) Write two ordered pairs that lie on your line. (d) Determine the equation of your linear function using the two ordered pairs from part (c) (e) Using your linear function from part (d), estimate, to the nearest foot, the height of a tree given that its diameter is 14 inches. (This type of calculation is called extrapolating; we are using a model to predict outside of our data set.)
Exercise 2 Calculator (a) Enter the data into your calculator as follows. Step 1 – Hit the STAT button and go to the Edit submenu. Step 2 – Enter the Diameters under L1 and the Heights under L2. When working with a data set, always place the independent variable in L1 and the dependent variable in L2. (b) Find the equation for the line of best fit. Round your coefficients to the nearest tenth. Also, define what each variable, x and y, represent. Step 1 – Hit the STAT button and go to the CALC submenu. Step 2 – Go the choice 4 – LinReg(ax+b). Hit ENTER twice.
Partner Activity • Work with a partner to complete your piece of worksheet.
Assessment Online Self Checking Quiz Homework - Complete Problems Line of Best Fit HW • Pearson Online Self Checking Quiz http://www.phschool.com/webcodes10/index.cfm?fuseaction=home.gotoWebCode&wcprefix=ata&wcsuffix=0607