Download

1 / 12
120 likes | 217 Views
Study on extreme rain rates causing flash flooding in KC area, downscaling U.S. precipitation estimates, runoff frequencies, and excess runoff climatology.

E N D
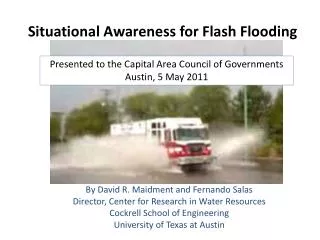
A Baseline Climatology of Precipitation Rates that Induce Flash Flooding in an Urban Environment Suzanne M. Fortin National Weather Service Pleasant Hill/Kansas City October 19, 2005
Objectives • To perform a quantitative assessment of short duration, extreme rain rates and historical precipitation return frequencies in the Kansas City metropolitan area and surrounding region • Downscale U.S.-scale precipitation frequency estimates utilizing HPD and Alert system • Build runoff return frequencies for the urban area • Integrate precipitation and runoff frequencies to build excess runoff climatology
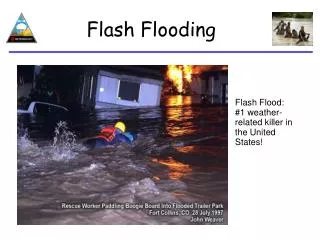
Why? • Kansas City has a history of extreme flooding and flash flooding. • Several news-worthy extreme flash flooding events in the past 50 years, with four extreme events occurring in the past 30 years. • Intense/extreme precipitation events have increased across CONUS (Knight, 1988) • Operational forecaster rule of thumb for flash flooding onset is outdated. • “Recent extreme” rain events and data excluded • Current technology – WSR-88D and Flash Flood Monitoring and Prediction program – often detect rain rates 3-4-5”/hour
Caveats • Will not address meteorological conditions associated with extreme rain events in Missouri and eastern Kansas (Junker, 1993; Moore, 1995 & various; Glass, 1998; Glass et al., 1995; Maddox et al., 1979). • Will not address WSR-88D rain rate climatology
Urban Flash Flood Hydrology • By definition (NWS), flash flood producing rains have durations of six hours or less • Onset of flooding in urban areas much greater due to impervious surfaces, disruption of natural water balance, increased flood peaks (Young, H.Y, 2000; Sauer et al., 1983) • Four of the most significant flash flood episodes in the past 25 years in the urban core of Kansas City have occurred within 1 to 3 hours of the onset of rain, producing twice the quantity of rain indicated in NWS Hydro-35 (NOAA, 1977)
Urban Flash Flood Hydrology • Storm water treatment and design typically utilize 10 year, 24-hour, 90% rainfall event for cost mitigation (SWRC, 1998) • Analysis of KC storm water design found system will accommodate 1.37”/hour (Young & McEnroe, 2002) • Runoff return rates at other durations and frequencies difficult to obtain/access • Design rather than geomorphology dictate level of excess – a difficult concept for forecasters to grasp
Comparison of Rainfall Frequencies Courtesy of OPSWM
Revised 60-minute Rainfall Frequency Curve for Kansas City • Utilized QC’d hourly precipitation data from 20 HPD sites • Developed frequency distribution of rainfall categories ≥1.0 (NOAA Hydro35, Young & McEnroe, 2002) • Utilized Hydro35 regression equations to develop revised distribution
Conclusions • Downscaling of rainfall frequencies indicate rates greater than values from Hydro35 • Developing excess runoff return frequencies not as tangible, but have something to build upon • Integrate rainfall/excess runoff frequency to establish urban FFTI • Based on rainfall rate frequencies, KC urban core will need to continue to enhance storm water design to mitigate flooding • Important to take advantage of recent, dense data networks
Future Research • Recalibrate coefficients for return frequencies • Expand analysis to develop frequency curves based on 15-, 30-, 90-, 120-minute data (ASOS, Alert, DCP) • Reprocess data utilizing PDF employed by Young & McEnroe, 2002 and Angel & Huff, 1992 • Work with local storm water management groups to establish excess runoff frequencies