Download

1 / 1
10 likes | 144 Views
Convective System analysis using Space- and Ground-Based Radar Reflectivity and Derived Rainfall. NPOL. TOGA. MIT. Common Operating Period: 19 August – 16 September 2006. a). b). a. c. b. f. d. e. N. Guy 1 , S. A. Rutledge 1 , R. Cifelli 2 , and T. Lang 1

E N D
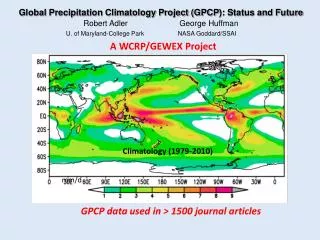
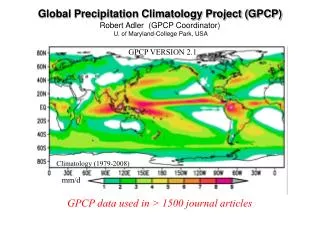
Convective System analysis using Space- and Ground-Based Radar Reflectivity and Derived Rainfall NPOL TOGA MIT Common Operating Period: 19 August – 16 September 2006 a) b) a c b f d e N. Guy1, S. A. Rutledge1, R. Cifelli2, and T. Lang1 1 Department of Atmospheric Science, Colorado State University, Fort Collins, CO, USA; 2NOAA Earth Systems Research Laboratory, Boulder, CO, USA Corresponding author email: guy@atmos.colostate.edu 2006 WAM Results Time Series Radar-derived rainfall time series for the common operating period of the three radars were compared with concurrent 3B42 rainfall estimates (Fig. 4) to establish a larger-scale data set that can be used for analysis of the domain shown in Fig. 1. Qualitative agreement is evident, with notable peaks occurring during the passage of mesoscale convective systems (MCS). Radar reflectivity is used to derive rainfall via the traditional R=aZb relationship, obtained for each region from literature, based on disdrometer measurements in various regions in Africa. First order disagreement in magnitude is likely related to the Z-R relationship chosen for processing. Further study comparing the Z-R used by the TRMM 2A25 product (PR) with the ground-based will be performed to enhance the understanding of the performance of each type of radar system in this region. Introduction The African Monsoon Multidisciplinary Activities (AMMA) and NASA-AMMA (NAMMA) field campaigns focused on a better understanding of the West African monsoon (WAM) and the role of African easterly waves (AEWs), respectively. Among the observational components were ground-based radars located near Niamey, Niger (MIT), Kawsara, Senegal (NPOL) and Praia, São Tiago (TOGA), all near 15ºN, a transitional latitude in terms of northward moisture transport during the monsoon (Fig. 1). A regional analysis of convective storms associated with the monsoon season was performed. Special attention was given to local regions surrounding each radar location. System structure, motion, and rain variability derived from radar reflectivity data were analyzed with ECMWF reanalysis data and satellite precipitation data (TRMM) to study convective events during the 2006 monsoon season. Climatology Precipitation 3B42 climatological precipitation is presented for July-September (peak monsoon period) in Fig. 2a, along with the 2006 season anomaly (Fig. 2b). The anomaly is a ratio of the 2006 season divided by the climatological mean at each point within the domain shown (0.25° resolution). Values less than unity represent a rainfall deficit, while values greater than one show precipitation greater than the climatological mean. The green boxes represent 5° x 5° region centered at each radar location. Each region shows a precipitation anomaly slightly greater than climatology, with TOGA 14% above, NPOL 6% above, and MIT13% above the regional means. Analysis of the TRMM LIS lightning climatology showed no significant deviation from climatological mean. The 2006 season presented only ~20 overpasses of the TRMM PR concurrent with observed ground-based radar echo, of these only 7 had tracks that were conducive to further analysis. Unfortunately only one case of MCS precipitation was observed. Figure 7 showsthe near surface reflectivity (top left) and estimated surface rainrate (top right), along with associated ground-based radar representations of the same two fields (middle). Most noticeably, the TRMM rainfall has a very strange distribution, and while this is not uncommon this represents an extreme case. The retrieved horizontal reflectivity distributions show similar structure, though the ground-based radar yields lower reflectivity values for the trailing stratiform. The bottom plot shows PDF distributions of reflectivity and rainrate, showing a larger amplitude peak along with the distribution shifted to higher values in both reflectivity and derived rainrate. Figure 1. Ground-based radar observations located in Niamey, Niger (MIT); Kawsara, Senegal (NPOL); and Cape Verde Islands (TOGA) during the 2006 WAM season. Figure 4. Time series of radar-derived and TRMM 3B42 rainfall for the common operating time in boreal summer 2006, for TOGA (top), NPOL (middle), and MIT (bottom). Figure 8 TRMM overpass coincident with trailing stratiform following SLMCS passage (left). CFAD (right) of TRMM (colored contours) and MIT radar (line contours) over plotted. Figure 2. Boreal summer (JAS) precipitation climatology (a) using the TRMM 3B42 blended product and the 2006 anomaly using a ratio scale. The general agreement in Fig. 4 allows confidence of further analysis of convective systems spanning a large spatial range. A longitude-time diagram of 3B42 rainfall estimations (latitudinal averaging from 12-17°N) is shown in Fig. 5. The colored contours represent percentage of pixels that meet the > 0.8 mmhr-1 threshold. Warmer colors are indicative of widespread rainfall, often associated with MCS passages. Subjectively analyzed MCS at each radar location are indicated with black dots. Obvious westward propagating precipitation modes (PPMs) are apparent in the figures. The light gray shading indicates the presence of an AEW, showing that some PPM are associated with AEW propagation, while others are not. Regional reflectivity The University of Utah precipitation feature database (Nesbitt et al. 2000; Liu et al. 2007) was employed to create climatological plots of reflectivity obtained via the precipitation radar. The database is a processed version of levels 1 and 2 TRMM products, with unique level 2 and 3 products. One advantage of these products are that only points where valid PR information exists are saved, greatly reducing file size. Also, a number of other variables, including IR and microwave radiometer brightness temperatures and LIS lightning flash information is collocated with the PR data (not shown). The vertical reflectivity plots (Figs. 3a-c) show that increasing the domain size around the radar location results in higher reflectivity at all levels for mean and maximum profiles, except for the TOGA domain. This is likely due to the location of theTOGA domain in the Atlantic north of where the majority of large disturbances exit the coast and also the less frequent occurrence of intense convection when compared to continental sites. Data Radars TOGA (14.92ºN, 23.48ºW) C-band radar, operating period : 15 August – 16 September 2006, 10-minute collection interval NPOL (14.66ºN, 17.10ºW) S-band; polarimetric, operating period: 19 August – 30 September 2006, 15-minute collection interval MIT (13.49ºN, 2.17ºE) C-band radar Operating 5 July – 27 September 2006 10-minute collection interval Note: ~150 km unambiguous range, 130 km used in convective/stratiform partitioning and calculations Satellite TRMM PR Ku-band, near continuous operation since December 1997 3B42 Blended rainfall product on a 0.25°x 0.25° grid. The estimation is obtained via adjusting IR estimates to microwave rainfall retrievals, with monthly validations using rain gauge data. Univ. Utah Precipitation Feature database. Processed Level 1 & 2 TRMM data, minimizing file size and grouping pixels together via feature algorithm • Summary • West African monsoon was studied using a wide variety of observational data. • The 2006 observational period showed slightly above climatological average precipitation, and did not significantly deviate from climatology in terms of lightning density and distribution and number of AEWs. • TRMM PR climatological analysis suggests a longitudinal dependence of mean and maximum vertical structure. The inland location exhibits a similar profile as the coastal site, though a more pronounced evaporative signature is obvious inland. • CFAD reflectivity analysis suggests stronger reflectivity at the surface inland and deeper convection. The oceanic environment shows substantially shallower convection and a more maritime distribution, consistent with current knowledge. • Propagating precipitation modes are evident in a westward progression across Africa, with variable degrees of association with African easterly wave passage. Future Work • Establish statistical climatological database using the Utah precipitation feature database and reanalysis environmental information, with latitudinal and longitudinal banding. • Comparison of Z-R relationships employed in TRMM algorithms with those used for ground-based radar data. • Using Goddard MMF GCM, simulate convective systems associated with AEW and those that are not. • Case study of time period noted in Fig. 5, with ground-based radar analysis and WRF model simulation. Figure 5. 3B42 rainfall estimation longitude-time diagram for the 2006 peak WAM season average 12-17N. Heavy vertical lines represent the longitudinal location of each radar, while the light vertical lines show the approximate locations of elevated terrain important in the genesis of MCS events. Red brackets indicate a case singled out for future study. Figure 6. 1km CAPPI and vertical reflectivity profile at each radar location during time period indicated by red brackets in Fig 5. Figure 3. Ten-year TRMM PR climatology of mean and maximum vertical reflectivity profiles (a-c) and reflectivity CFAD (d-f) for each region using a 5º box. Acknowledgments. This research was supported by NASA grant number NNX08AT77G.