Download
1 / 10
100 likes | 225 Views
This study investigates the effects of Dr. Tom’s Elixir on IQ improvement in subjects over six weeks. By employing a paired design, baseline IQ data was collected, and after providing the supplement (subject to quality control), subjects were retested. Although there appeared to be some improvement, a two-sample t-test yielded a p-value of 0.8458, indicating the observed differences may be due to chance. A revised analysis considering practical significance revealed an effect size of 0.0889, categorizing the changes as negligible in psychometric terms.

E N D
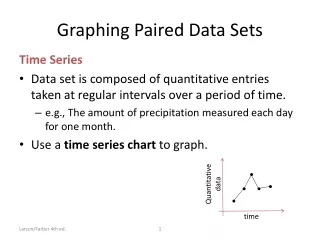
Paired Data Statistical control of variability
Dr. Tom’s Elixir to Improve Performance(of whatever) • Select victims (oops, subjects) • Collect baseline data on IQ • Give Snake Oil supplement (subject to rigorous QC and QA standards) • After six weeks retest subjects • Test for “significant” improvement in IQ
Is there an improvement? • A lot of “noise” is in the data • Pre vs. Post seems to show a slight improvement • All subjects showed some degree of improvement • Need significant p-value for Marketing!
Some dependency appears in data due to repeated measurements on each subject
What would a two-sample t-test show? • A two sample t-test gives a p-value of .8458 • Therefore this difference is likely due to chance • But everyone improved!! • Call a Statistician!
Statistical consultant notes: • The design was correct • The analysis did not take into account that the data was paired • One should analyze the differences instead of individual values • We take all major credit cards
Practical vs. Statistical Significance • A study can always be designed to pick up “small” differences. • Practical Significance is typically evaluated by looking at the ES or Effect Size. • The ES is the Mean Improvement divided by the Standard Deviation (of the population, not differences). • If the Standard Deviation of a typical IQ instrument is about 10, then the ES that was observed is about .0889, which would be considered very small in the Psychometric literature.