Download
1 / 31
350 likes | 887 Views
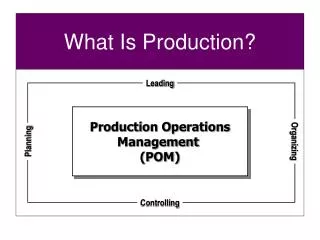
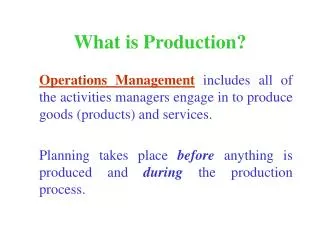
1. 1. Reviewing the Basics 2. Production Possibilities Frontier 3. The Economic Problem 4. Comparative Advantage. What is Production?. Production is the process by which resources are transformed into useful goods and services.

E N D
1 1. Reviewing the Basics2. Production Possibilities Frontier3. The Economic Problem4. Comparative Advantage
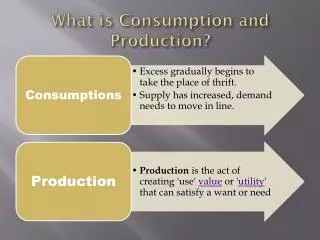
What is Production? • Production is the process by which resources are transformed into useful goods and services. • Resources (or inputs) refer to anything that can be used, directly or indirectly, to satisfy human wants. • Natural resources [LAND] • Human resources [LABOR] • Capital resources [CAPITAL]
Three Basic Questions • Decision-making in a larger economy is more complex, but the types of decisions that must be made are the same as individuals make for themselves • All societies must decide: • What will be produced? • How will it be produced? • Who will get what is produced?
Capital Goods vs. Consumer Goods • Consumer Goods are goods produced for present consumption. (sometimes called “final goods”) • Capital Goods are goods used to produce other goods or services over time.
Positive vs. Normative PositiveEconomics (focus: efficiency) NormativeEconomics (focus: equity)
Weighing Present and Expected Future Costs and Benefits • Investment: the process of using current resources to produce future benefits • Because resources are scarce, the opportunity cost of any investment is forgone present consumption.
The Production Possibility Curve • The Production Possibility Curve (PPC) is a graph that shows all of the combinations of goods and services that can be produced if all of society’s resources are used efficiently.
The Production Possibility Curve • The production possibility curve has a negative slope that indicates the trade-off that a society faces between two goods.
The Production Possibility Curve • Points inside of the curve are inefficient. • We refer to this situation as Underutilization. • At point H, resources are either unemployed, or are being used inefficiently.
The Production Possibility Curve • Point F is desirable because it yields more of both goods, • However, it is not attainable given the amount of resources currently available in the economy.
The Production Possibility Curve • Point C is one of the possible combinations of goods produced when resources are fully and efficiently employed.
The Production Possibility Curve • A move along the curve illustrates the concept of opportunity cost. • In order to increase the production of capital goods, the amount of consumer goods will have to decrease.
The Law of Increasing Opportunity Cost • The concave shape of the production possibility curve reflects the law of increasing costs. • As we increase the production of one good, we sacrifice progressivelymore of the other.
Economic Growth • Economic growth is an increase in the total output of the economy. It occurs when a society acquires new resources, or when it learns to produce more using existing resources. • The main causes of economic growth are capital accumulation and technological advances.
Economic Growth • To increase the production of one good without decreasing the production of the other, the PPF curve must shift outward. • Economic Growth is represented by an outward shift of the entire curve • From point D, the economy can choose any combination of output between F and G.
Economic Growth • Every sector of the economy does not grow at the same rate. • In this historic example, productivity increases were more dramatic for corn than for wheat over this 50-year period.
The Economic Problem • The ECONOMIC PROBLEM: Given scarce resources, how, exactly, do large, complex societies go about answering the three basic economic questions? • Economic Systems are the basic arrangements made by societies to solve the economic problem. They include: • Centrally-Planned Economy [aka. command system] • Free Market Economy [aka. capitalist system] • Traditional Economy • Mixed systems
The Economic Problem • In a centrally-planned economy, a central government either directly or indirectly sets output targets, incomes, and prices. • In a free market economy,the policy is Laissez-Faire (literally from the French: “allow (them) to do”). Individual people and firms pursue their own self-interests without any central direction or regulation. This system is based on the existence of FREE MARKETS. • A market is the institution through which buyers and sellers interact and engage in exchange.
Mixed Systems, Markets, and Governments Markets are not perfect, and governments play a major role in modern economic systems in order to: • Minimize market inefficiencies • Provide public goods • Redistribute income • Stabilize the macroeconomy [“the big picture”] • Promote low levels of unemployment • Promote low levels of inflation
Specialization, Exchange and Comparative Advantage • David Ricardo (British Economist) developed the theory of comparative advantage to explain the benefits of specialization and free trade. The theory is based on the concept of opportunity cost: • Opportunity cost is that which we give up or forgo, when we make a decision or a choice.
Specialization, Exchange and Comparative Advantage • According to the theory of comparative advantage,specialization and free trade will benefit all trading parties, even those that may be absolutely more efficient producers.
Memory Devices:For calculating Opportunity Cost quickly(lower Opp. Cost has Comparative Adv.) O O O Ouput Other Over I O U Input Other Under
Absolute Versus Comparative Advantage • Which country has an absolute advantage? • Country A, because it can produce more food and more clothing in one day than country B. • Which country has a comparative advantage in the production of Food? • because a worker in country A can produce 6 times as many units of food as a worker in country B, but only 1.5 as many units of clothing.
Absolute Versus Comparative Advantage • The opportunity costs can be summarized as follows: • For food: • 1 unit of food costs country A ½ unit of clothing. • 1 unit of food costs country B 2 units of clothing. • For clothing: • 1 unit of clothing costs country A 2 units of food. • 1 unit of clothing costs country B ½ unit of food.
Absolute Versus Comparative Advantage Conclusion: What will happen??? • Each country should prefer to produce whichever has a LOWER opportunity cost to them. • Country A will specialize in food, and Country B will specialize in clothing. • Specialization also works to develop skills and raise productivity.
Absolute & Comparative Advantage Example #1 - an OUTPUT problem • In a given day, the US can produce 20 units of wheat or 10 units of corn. Canada can produce 20 units of wheat or 5 units of corn. Would the two trade? If so, what would this trade look like?
Absolute & Comparative Advantage Example #1 - an OUTPUT problem • In a given year, the US can produce 100 units of iPods, or or 50 units of TVs. China can produce 200 units of iPods or 120 units of TVs. Would the two trade? If so, what would this trade look like?
Absolute & Comparative Advantage Example #2 - an INPUT problem • It costs the US 1 hour of labor per unit of wheat, or 2 hours of labor per unit of corn. It costs Canada 1 hour of labor per unit of wheat, or 4 hours of labor per unit of corn. • Would the two trade? If so, what would this trade look like?