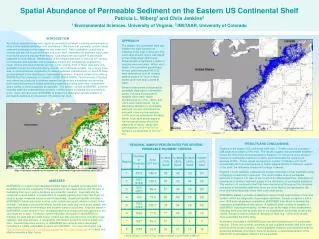
Projects Mapping the DOC on the Eastern US coast
380 likes | 510 Views
People Ajit Subrmaniam (PI) (1-2) Rossana Del Vecchio (Co-PI) (1-2) Jim Nelson (Co-PI) (1) Douglas Capone (Co-PI) (2). Projects Mapping the DOC on the Eastern US coast Tropical Rivers impact on C and N cycles (marine ecosystems/primary productivity).

Projects Mapping the DOC on the Eastern US coast
E N D
Presentation Transcript
PeopleAjit Subrmaniam (PI) (1-2)Rossana Del Vecchio (Co-PI) (1-2)Jim Nelson (Co-PI) (1)Douglas Capone (Co-PI) (2) Projects Mapping the DOC on the Eastern US coast Tropical Rivers impact on C and N cycles (marine ecosystems/primary productivity)
Can the photochemical oxidation of carbon to CO2 on continental shelves be estimated from satellite ocean color measurements? Rossana Del Vecchio*, Neil V. Blough+, Stephanie Uz#, Joaquim Ballabrera*, Christopher W. Brown#, Ajit Subramaniam± *Earth System Science Interdisciplinary Center (ESSIC), University of Maryland, College Park, USA +Departement of Chemistry, University of Maryland, College Park, USA #National Oceanic and Atmospheric Administration (NOAA), USA ± Lamont Doherty Earth Observatory, Palisades, USA
Introduction • Large amounts of carbon as dissolved organic carbon (DOC) are annually transferred from continents to the ocean through rivers. • DOC in the ocean can play a very important role in the global carbon cycle, being comparable to carbon in the atmosphere. • Yet, the spatial distribution and variability of carbon sources and sinks at regional to global scales is far from being precisely quantified.
Background • In coastal environments influenced by riverine discharge, a significant fraction of DOC [the CDOM] is capable of absorbing visible and ultraviolet light and hence can be detected by ocean color satellite sensors. • However, the aCDOM to DOC ratio is highly variable spatially and seasonally ……… (ie sources and sinks of CDOM and DOC are uncoupled)……… complicating the DOC remote detection (Del Vecchio and Blough, 2004, Marine Chemistry)
Background • During summertime stratification significant photochemical loss of CDOM absorption occurs in surface waters of the Middle Atlantic Bight (MAB) (Del Vecchio and Blough, 2004, Marine Chemistry)……… ………that is uncoupled to DOC photochemical loss.
Scientific questions Is this seasonal change in CDOM absorption evident from ocean color measurements? • Knowing that the photochemical loss of CDOM absorption (~100%) is coupled to a photochemical oxidation of carbon to CO2 (~ 15%), can the photochemical oxidation of carbon to CO2 on continental shelves be estimated from satellite ocean color measurements?
Methods • Employ the Johannessen et al. algorithm (2003) to convert L3 images of monthly averaged normalized water leaving radiance (nLw(l)) to aCDOM(l) images from 1997 to 2003 • Estimate the spatial/temporal CDOM absorption deficits (Da) caused by photobleaching ……… [Da=(aCDOMmonth-aCDOMref)/aCDOMref] • Convert Da to estimates of photochemical production of carbon to CO2 CO2 photoproduction = ∫ (aCDOMref-aCDOMmonth) * M where M = mld * 0.15 / a*CDOM (g of C/m2/integrated…...)
Algorithm validation • In situ vs modeled aCDOM(323) (weekly average) March 2003 July 1998 September 1998 October 1999
Algorithm validation • In situ vs modeled aCDOM(323) (monthly average) March 2003 July 1998 September 1998 October 1999
Algorithm product: aCDOM(323)-1998 January February March April May June July August September October November December
Algorithm product: aCDOM(323)-1999 January February March April May June July August September October November December
Algorithm product: aCDOM(323)-2000 January February March April May June July August September October November December
Algorithm product: aCDOM(323)-2001 January February March April May June July August September October November December
Algorithm product: aCDOM(323)-2002 January February March April May June July August September October November December
Algorithm product: aCDOM(323)-2003 January February March April May June July August September October November December
Da(323) for 1998: spatial and seasonal distributionDa(323)=(aCDOMmonth-aCDOMref)/aCDOMref January February March April May June July August September October November December
Da(323) for 1999: spatial and seasonal distributionDa(323)=(aCDOMmonth-aCDOMref)/aCDOMref January February March April May June July August September October November December
Da(323) for 2000: spatial and seasonal distributionDa(323)=(aCDOMmonth-aCDOMref)/aCDOMref January February March April May June July August September October November December
Da(323) for 2001: spatial and seasonal distributionDa(323)=(aCDOMmonth-aCDOMref)/aCDOMref January February March April May June July August September October November December
Da(323) for 2002: spatial and seasonal distributionDa(323)=(aCDOMmonth-aCDOMref)/aCDOMref January February March April May June July August September October November December
Da(323) for 2003: spatial and seasonal distributionDa(323)=(aCDOMmonth-aCDOMref)/aCDOMref January February March April May June July August September October November December
CO2 photoproduction (g of C/m2/integrated…...) 1998: CO2 photoproduction = ∫ (aCDOMref-aCDOMmonth) * M January February March April May June July August September October November December
CO2 photoproduction (g of C/m2/integrated…...) 1999: CO2 photoproduction = ∫ (aCDOMref-aCDOMmonth) * M January February March April May June July August September October November December
CO2 photoproduction (g of C/m2/integrated…...) 2000: CO2 photoproduction = ∫ (aCDOMref-aCDOMmonth) * M January February March April May June July August September October November December
CO2 photoproduction (g of C/m2/integrated…...) 2001: CO2 photoproduction = ∫ (aCDOMref-aCDOMmonth) * M January February March April May June July August September October November December
CO2 photoproduction (g of C/m2/integrated…...) 2002: CO2 photoproduction = ∫ (aCDOMref-aCDOMmonth) * M January February March April May June July August September October November December
CO2 photoproduction (g of C/m2/integrated…...) 2003: CO2 photoproduction = ∫ (aCDOMref-aCDOMmonth) * M January February March April May June July August September October November December
Conclusions • The seasonal change in CDOM absorption attributable to photobleaching is evident in the ocean color measurements • Algorithm overestimates ‘off-summer’ months • CO2 photoproduction can be estimated from the absorption deficit observed in the ocean color measurements, but…… • Correct reference state • Hydrography • Advection of water masses with different end members • ……………………… Acknowledgements NASA, NSF, NOAA, ONR (past)
Aknowledgement • NASA, NSF, NOAA
Assumptions • Non-moving water masses • Constant Mixed Layer Depth • a*(355)=a*(323)
DA(323) for 1998:spatial and seasonal distribution January February March April May June July August September October November December
Photochemical C Flux for 1998(g of C/m2/month) January February March April May June July August September October November December
Photochemical C Flux for 1999(g of C/m2/month) January February March April May June July August September October November December
Photochemical C Flux for 2000(g of C/m2/month) January February March April May June July August September October November December
Photochemical C Flux for 2001(g of C/m2/month) January February March April May June July August September October November December
Photochemical C Flux for 2002(g of C/m2/month) January February March April May June July August September October November December
Photochemical C Flux for 2003(g of C/m2/month) January February March April May June July August September October November December