Download

1 / 16
160 likes | 283 Views
Global migration of carbon impurities in the ASDEX Upgrade tokamak. Euratom-Tekes Fusion Seminar Tartu, 29-30 May, 2012 Antti Hakola VTT Technical Research Centre of Finland. Collaborators: S . Koivuranta, J . Likonen : VTT

E N D
Global migration of carbon impurities in the ASDEX Upgrade tokamak Euratom-Tekes Fusion Seminar Tartu, 29-30 May, 2012 Antti Hakola VTT Technical Research Centre of Finland Collaborators: S. Koivuranta, J. Likonen: VTT M. Groth, T. Kurki-Suonio, V. Lindholm, T. Makkonen, J. Miettunen: Aalto University A. Herrmann, K. Krieger, M. Mayer, H. W. Müller, R. Neu, V. Rohde: IPP-Garching P. Petersson: KTH
Materialmigration: why is itimportant? • ”Materialmigration is importantbecauseit is net, ratherthangross, erosionwhich is of practicalconsequence” (P. C. Stangeby) • In other words, necessary step between • erosion of plasma-facing components and • deposition of the eroded material & retention of plasma fuel (particularly T) in fusion reactors How can the migration mechanisms in tokamaks be elucidated? • Carry out tracer injection experiments (e.g. 13C) just before venting the vessel for maintenance • Analyze a comprehensive set of first-wallcomponentsfor theirsurfacedensities of the tracerelements • Try to obtain – and predict– the resulting deposition profilesnumerically
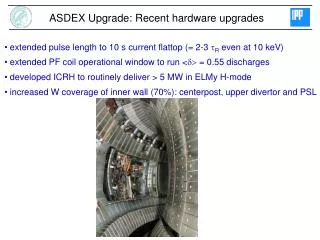
This presentation concentrates on migration studies in ASDEX Upgrade (AUG) AUG is an ITER- and DEMO-relevant environment for migration studies all the first-wall structures W-coated graphite tiles since 2007 Migration can be studied both globally and locally: Here the focus in on the global scale • isotopically labelled methane (13CH4)(and recently also 15N2) injected into the torus from one valve at the outer midplane • results modelled using the ASCOT, DIVIMP, and SOLPS codes
Master table of the AUG global 13C/15N experiments See A. Hakola et al., Plasma Phys. Control. Fusion 52, p. 065006, 2010 A. Hakola et al., Journal of Nuclear Materials (submitted)
The latestinjectionexperimenttookplace in 2011: globalinjection of both13C and 15N • High-density, lower single-null L-mode discharges in hydrogen • Altogether 11 shots (#27382-#27392), two reference shots (#27366, #27371) • 13C and 15N injected simultaneously, atomic ratio of 13C and 15N was 1:1 • Midplane manipulator in operation during the reference shots • Te, ne, and flow velocities at the outer midplane • Additional data for modelling purposes: • Teand ne distributions at the divertor from Balmer emission lines • jsat, Te, and ne data from fixed Langmuir probes (LP) at the strike-point zones • thermography data at the divertorplates (temperature and power density) • bolometer data to estimate radiated power in different regions
Tiles analyzed using SIMS at VTT – first extensive analysis program after the 2007 experiment SIMS = Secondary Ion Mass Spectrometry 5-keV O2+primaryionbeam, current 500 nA, analysisarea 300×430 mm2 • In 2007, 13C distribution measured from • selected W-coated graphite tiles (3-5 mm or 200 mm) • uncoated graphite regions of marker tiles (divertor) • small Si samples (remote areas) Si samples Si samples
Why to botheranymore: everythingwasclearafter the 2007 experiment!? Well, notreally… Totallydifferent deposition behavior on W and on C, especially at the outerdivertor Only 4 - 9% of injected13C foundexperimentally Is the appliedassumption of toroidallysymmetric deposition valid?
Predictive ASCOT modelling indicates strong deposition hot spots at certain toroidal locations Is thisreally the case? Mustbecheckedexperimentally!
39 walltilesremoved for postmortemanalysesafter the 2011 injectionexperiment • Tiles removed for analyses marked in red • Especially: • tiles removed from many different toroidal locations at the outer midplane: two ICRH antennas, two different poloidal limiters • samplestakenfrom the side faces of the removedtiles deposition in tilegaps! Tile A1/2RIGHT Plasma-facing samples Gapsamples 17 mm
Results (1): remarkable deposition at the outer midplane • largest surface densities (up to 1018-1019 at/cm2) localized to the vicinity of the injection valve • deposition decays from the peak values to 1016 at/cm2 within 100 mm • large differences in 13C levelsbetweentiles from different ICRH antennas and poloidallimiters • toroidallysymmetric deposition not a validassumption
Results (2): deposition profiles in different regions of the torus Deposition at upperdivertor (UD) heatshield (HS) innerdivertor (ID), roofbaffle (RB), and outerdivertor (OD) tilegaps • UD: rather uniform deposition, results in line with the 2007 profile • HS: situation dramatically changed from 2007 to 2011 plasma flows different? • lower divertor minor deposition region • OD: deposition profiles in 2011 qualitatively different from the 2007 case due to different magnetic configuration? or due to eroded tile surfaces? • tile gaps account for considerable 13C surface densities
Results (2): deposition profiles in different regions of the torus
Approximately 35% of the injected 13C found • toroidally symmetric deposition assumed for the inner divertor, roof baffle, outer divertor, upper divertor, and heat shield • at the outer midplane, the average 13C surface density multiplied the total surface area of the different limiter and ICRH antenna tiles Main chamber is the main deposition region for 13C
SOLPS modelling: range of background plasmas and flow profiles obtained ne,sep = 2.25 × 10¹⁹ m-3 ASCOT ne,sep = 1.5 × 10¹⁹ m-3 • SOLPS = 2D plasma fluidcode • shot #27385 with pure H plasma, ne,sep as a freeparameter • decent match for ne and Te at the OMP and OD – but notsimultaneously • background plasma corresponding to a fit for ne at OMP selected for ASCOT simulations (top) • SOLPS predicts weak plasma flow and stagnation point at the OMP in contradiction with typical situations in tokamaks
ASCOT modelling: imposed flow profile required • ASCOT = 3D Monte Carlo code • shot #27385, magnetic equilibrium at 2.8 s • test particles (300,000) followed until their deposition • ASCOT predicts strong, localized deposition at OMP • imposed flow profile required to shift deposition away from outer divertor • SOLPS flow profile predicts 50% at the outer divertor (experimentally: 1% of the 13C found)
Conclusions • Global 13C and 15N injection experiment successfully carried out in AUG in 2011 • A comprehensive set of toroidally and poloidallydistributedtilesanalyzed for their13C content • Experimentalhighlights: • Main chamber of AUG is the most prominent sink for 13C: almost 35% of the injected 13C found there • Gaps between tiles contain significant 13C inventories • Lowerdivertor is a minor deposition region for 13C • Status of numericalsimulations • SOLPS simulationsprovided a set of backgroundplasmas and poloidalflowprofilesbutflowsgenerallyratherweak and stagnationpointsoccur at wrongplaces • ASCOT simulations with the weak SOLPS plasma flow would deposit 50% of the particles at the outer divertor • imposed flow profile required to reproduce the observed localized deposition peaks at the outer midplane