Download
1 / 51
510 likes | 651 Views
Back to Basics, 2013 POPULATION HEALTH : Vital & Health Statistics. Presented by N. Birkett, MD Epidemiology & Community Medicine. 78.1: VITAL STATISTICS INFORMATION. What are the key causes of illness or death in Canada ? Common things are common

E N D
Back to Basics, 2013POPULATION HEALTH :Vital & Health Statistics Presented by N. Birkett, MD Epidemiology & Community Medicine
78.1: VITAL STATISTICS INFORMATION • What are the key causes of illness or death in Canada? • Common things are common • using epidemiology can help you run a better clinical practice • Hipocrates • How have disease incidence and mortality changed in Canada in the past 20 years? • Little good information on disease incidence except for reportable diseases and cancer (cancer registries)
TOPICS • Demography, population dynamics • Mortality • Morbidity • Summary measures of population health • Aboriginal health
Population Pyramids • Canada, 1901-2001 • Ontario 1901-2001 • Newfoundland 1949-2001 • Yukon 1901-2001
Circ Disease: 27.6% CANCER: 30.3% † † Pneumonia & influenza grouped with respiratory disease. Would increase infectious % to about 3.4%.
CANCER: 29.8% Circ Disease: 29.0% EXTERNAL CAUSES: 4.8%+ { † † † Pneumonia & influenza grouped with respiratory disease. Would increase infectious % to about 3.5%.
CANCER: 31.6% Circ Disease: 27.3% EXTERNAL CAUSES: 3.4%+ { † † † Pneumonia & influenza grouped with respiratory disease. Would increase infectious % to about 3.3%.
Cardio-vascular Cluster Cancer Cluster Suicide Crime ‘Other’ Cluster
Cancer and AgeAge-Specific Mortality Rates for All Cancers by Sex, Canada, 2003 Surveillance Division, CCDPC, Public Health Agency of Canada
Cancer and AgeAge-Specific Incidence Rates for All Cancers by Sex, Canada, 2003 Surveillance Division, CCDPC, Public Health Agency of Canada
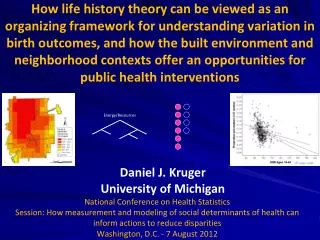
Income Inequalities SES (socio-economic status) • Lower worse health • Life expectancy 6.6 years lower in the poorest group. • Complex causal pathway • Nutrition • Race • Habits • Environmental/occupational • Access to/use of health/preventive services • Political isolation • Others
2 3 4 5 1 2 3 4 5 Income adequacy quintiles Remaining Life Expectancy at age 25. Based on 10-year follow-up to 1991 census Women Men
Remaining life expectancy at age 25 (conditional on surviving to age 25), 1991-2001
Probability of survival to age 75 (conditional on surviving to age 25), 1991-2001
Summary Measures of Population Health Combine mortality and a measure of morbidity
2001 Life Expectancy andHealth-Adjusted Life Expectancy • HALE always < LE • Females live longer (but gap is narrowing) • Females suffer more morbidity
Which Chronic Diseases? Cancer CHD Diabetes Respiratory Neuro-psych Musculoskeltal Sensory Cancer CHD Diabetes Respiratory Neuro-Psych Musculoskeletal Sensory
Potential Years of Life Lost (PYLL) First Nations Canada